■Line function
The Line function makes it possible to connect two points (including the blinking
pointer) created with the Plot function with a straight line. With this function, user
generated lines can be added to graphs to make them easier to read.
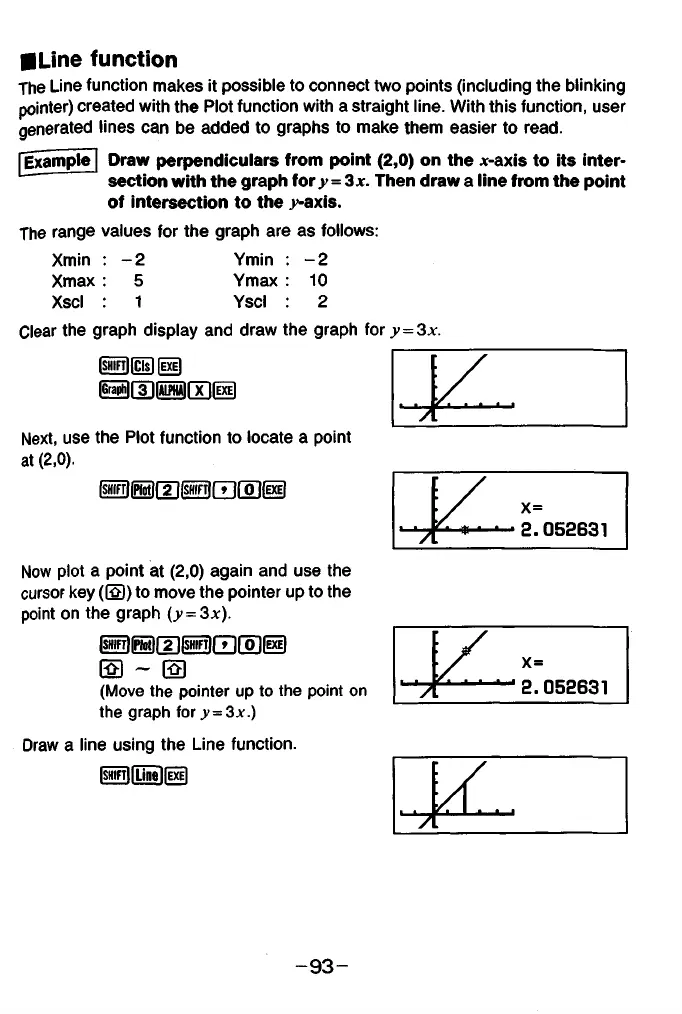
[ixample] Draw perpendiculars from point (2,0) on the x-axis to its inter
section with the graph for y = 3x. Then draw a line from the point
of intersection to the y-axis.
The range values for the graph are as follows:
Xmin : - 2 Ymin : - 2
Xmax : 5 Ymax : 10
Xscl : 1 Yscl : 2
Clear the graph display and draw the graph for y = 3x.
|siiirf|fcisl (exe)
Ifrapiilf 3 llALPHAimfExil
K -
' 'A
Next, use the Plot function to locate a point
at (2 ,0 ).
m iP iiitim isffiFrim roia
. ■ - n n c o e q i
A 0
Now plot a point at (2,0) again and use the
cursor key (El) to move the pointer up to the
point on the graph (y = 3x).
@ S @ @ 0 (jD(exe)
Fol ~ O
(Move the pointer up to the point on
the graph for y = 3x.)
Draw a line using the Line function.
|SHirT||LinelfEXEl
' 'A
[ « 2- 052631
- 9 3 -