3-3
Some Graphing Examples
The following examples are presented to show you some ways that the graphing
functions can be used effectively.
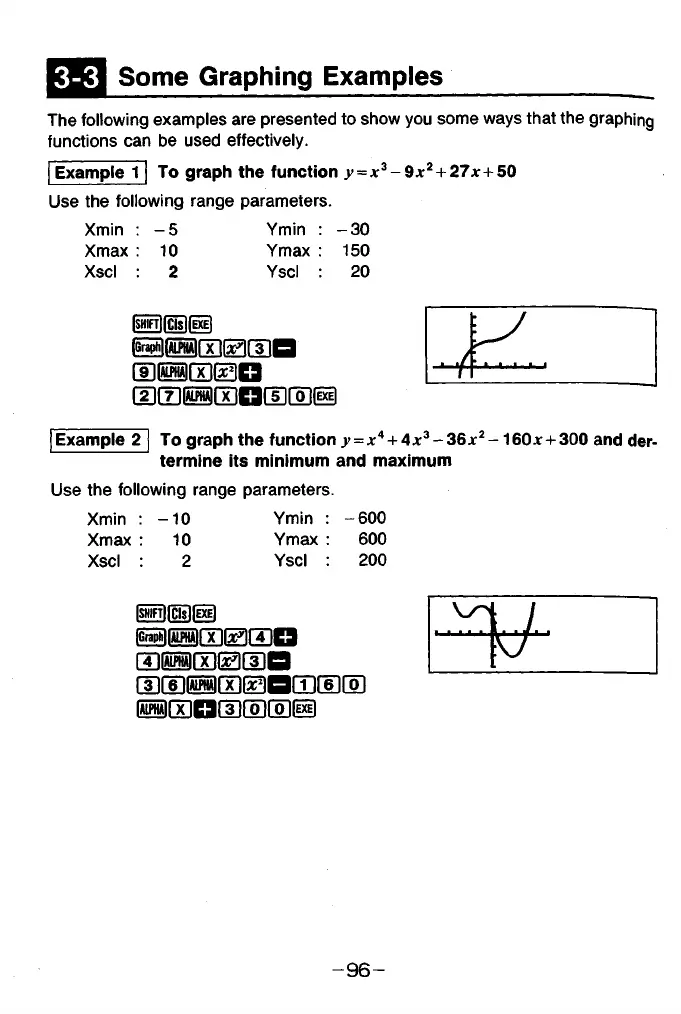
Example 1 To graph the function ^ = jc3- 9 jc2 + 27jc+ 5 0
Use the following range parameters.
Xmin : -5
Ymin : -3 0
Xmax :
10
Ymax : 150
Xscl : 2
Yscl :
2 0
iSHIFTj | CIs I IEXEI
( ^ W r x llF IIT lB
iaiBwnmgin
r ^ m r a m n r s i r o «
Example 2 | To graph the functiony = x* + 4x3-36jc2-160jt + 300 and der-
termine its minimum and maximum
Use the following range parameters.
Xmin :
- 1 0
Ymin : -600
Xmax : 1 0
Ymax :
600
Xscl :
2
Yscl :
2 0 0
ISHIFTllClsllEXEl
r a r a nriEFimn
I T lM I T ll^ f T lQ
r y im m n n iF iB m r s ir o i
w ir in iT ir ô ir ô iiix ii
V
- 9 6 -