Single-Variable Statistical Graphs
________
•Single-variable statistical graphs are drawn in the SD2 mode (@ @ Q ). “SD2”
appears on the display.
•Bar graphs and normal distribution curves can be produced as single-variable
statistical graphs.
•Function graphs are also possible in the SD2 mode, so graphs of theoretical values
and graphs of actual values can be overdrawn.
*Abs and 3\T"cannot be used in the SD2 mode.
•The maximum number of data items is identical to the number of memories.
You can expand memories up to a maximum of 19. If you specify a number greater
than 19, the unit automatically sets the number of memories as 19.
•Graphs are drawn with the ^-coordinate as the data range and the ^-coordinate
as the number of items (frequency) of each data.
•The m key is used for data input.
•The (¡¡9 key is used for data correction.
■Drawing single-variable statistical graphs
•Procedure
©Specify the SD2 mode ( I I B Q ) .
©Set the range values ( S ).
©Expand the memory in accordance with the number of bars (|^ IE ]ai^ |).
©Clear the statistical memories (IsijiFflisdllixEl).
©Input data (Data (dt)).
©Draw the graph.
•Bar graph
.................................
.
...............
rafsil
•Normal distribution curve
........................
iGraphiisHiFTifuiiili flxEl
*Data input method in step 5 is the same as that for standard deviation calcula
tions (see page 67).
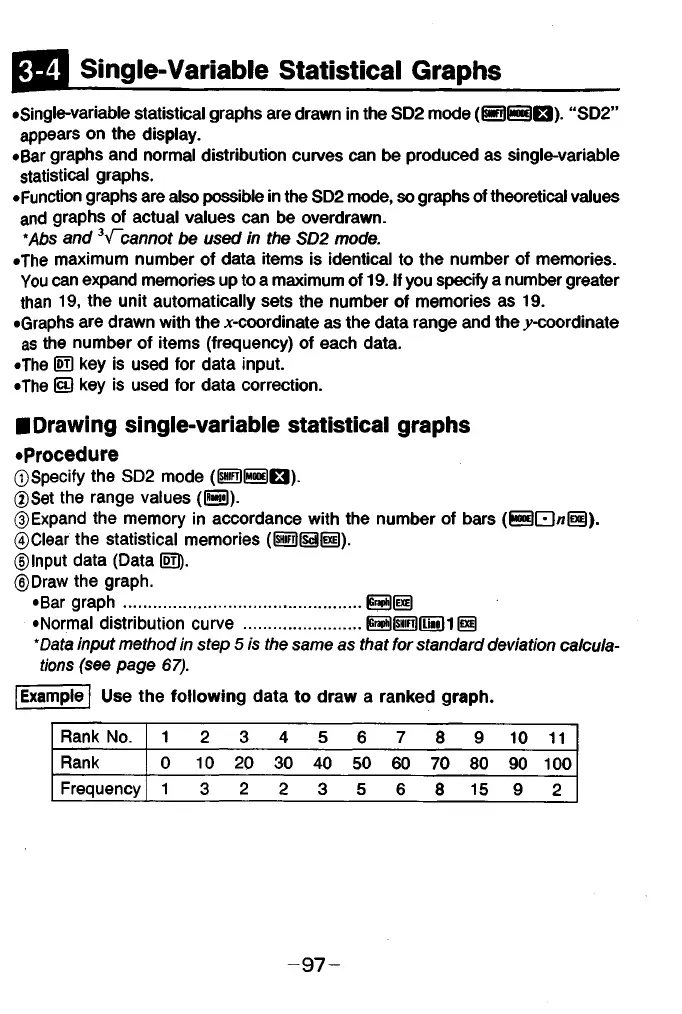
Example Use the following data to draw a ranked graph.
Rank No. 1
2 3 4
5 6
7
8 9
10
11
Rank
0 10
2 0
30
40 50 60
70 80
90
1 00
Frequency 1
3
2
2
3 5
6
8 15 9
2
- 9 7 -