Perform graph preparation in accordance with the following procedure:
©Specify the SD2 mode ( B B Q ) .
©Set the range values.
The highest value to be plotted on the x-axis is 100, but for graphing purposes
the maximum value (Xmax) is set at 110. (The general rule is that the minimum
value should be equal to or greater than the minimum range value and the max-
imum value should be less than the maximum range value, so here we set the
x-axis ranges to 0 through 11 0 ).
Ymax value is set to 20 for the >>-axis because the maximum frequency is 15
Xmin : ‘ 0 Ymin : 0
Xmax : 110 Ymax : 20
Xscl 10 Yscl 2
©Since the number of bars is 11(0-9, 10-19, 20-29.... 100-109), expand
memories by 1 1 .
©Clear the statistical memory.
IsHiFfllscillixi]
©Input the data.
0(DT)l0(lT)(DT)[DT)20[DT)(DT)30(Df)(Dr|40(Df)(DT)(DT)
5OiEIQ]5(DTl6Oi0CO6(DT)7Oli0[B8(DT)
80 S C 0 15(139 0 SC D 9 (dt) 100 GED (dt)
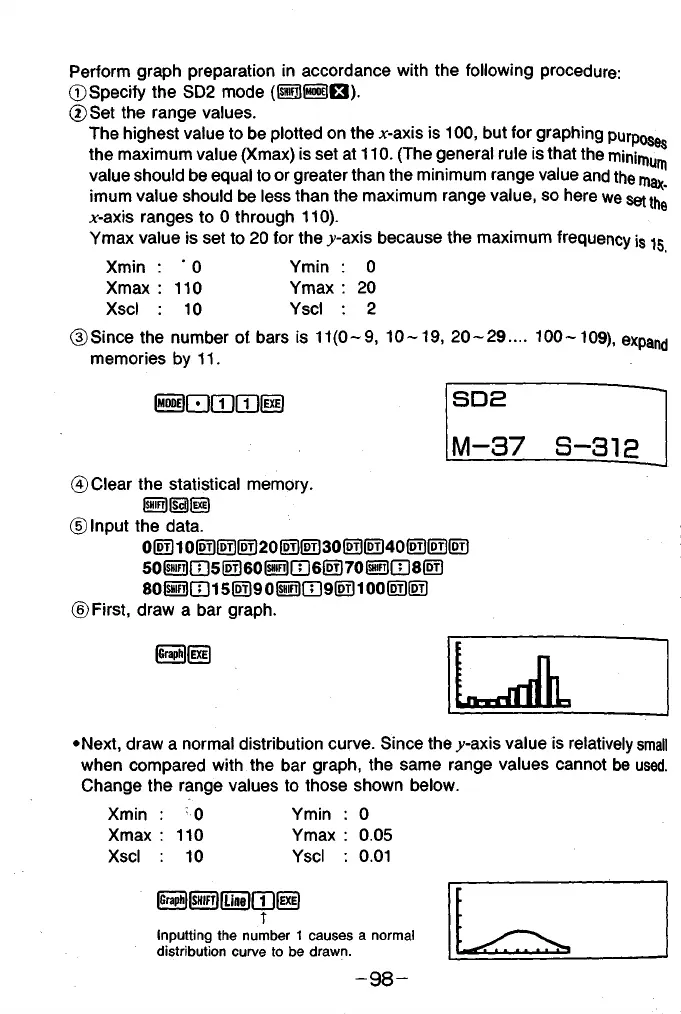
©First, draw a bar graph.
•Next, draw a normal distribution curve. Since the .y-axis value is relatively small
when compared with the bar graph, the same range values cannot be used.
Change the range values to those shown below.
S E D C D C D ®
S D E
M—37 S—312
Xmin : 0
Xmax : 110
Xscl : 10
Ymin : 0
Ymax : 0.05
Yscl : 0.01
T
Inputting the number 1 causes a normal
distribution curve to be drawn.
- 9 8 -