KEY
Example
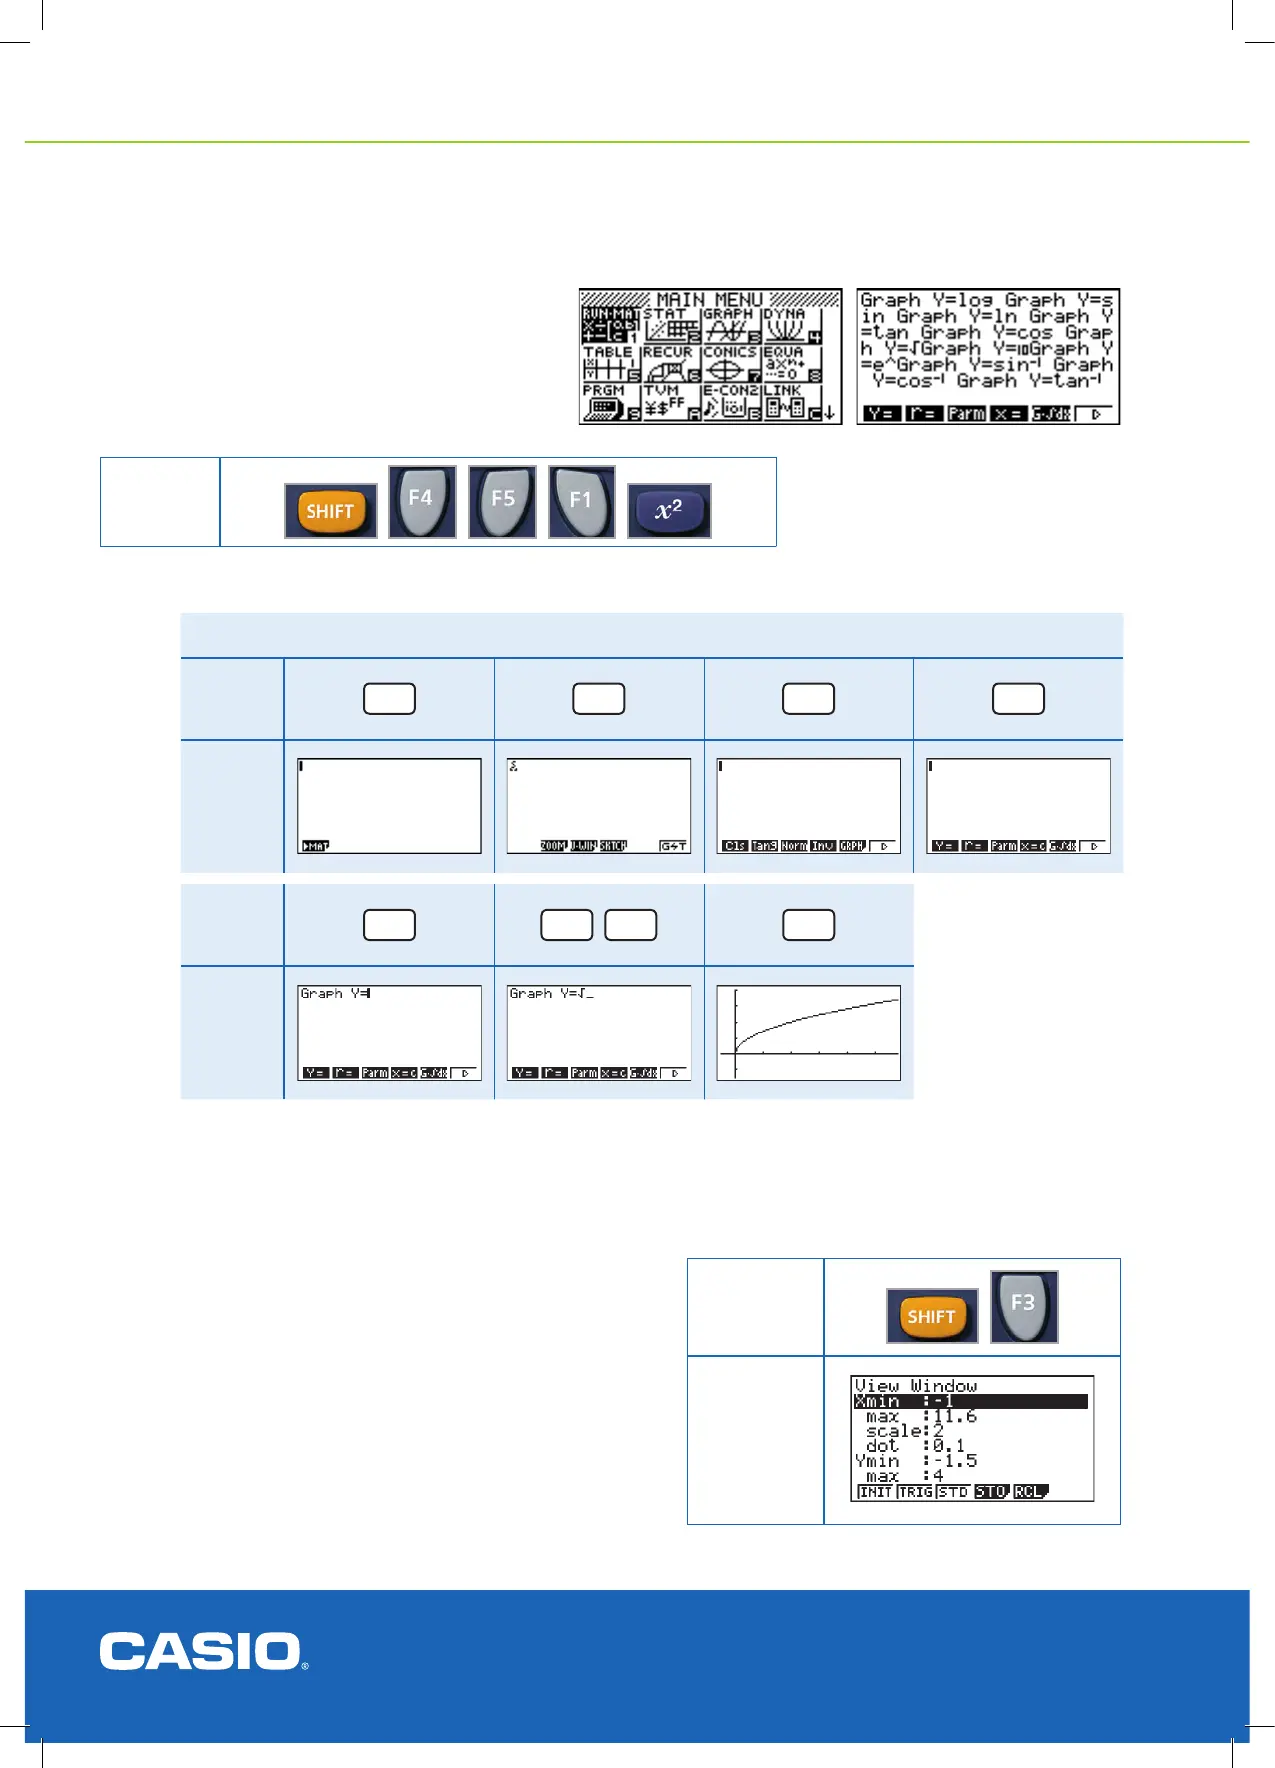
Draw the graph of y = √ x
Key
AC/
ON
SHIFT
F4 F5
Result
Key
F1
SHIFT
x
2
EXE
Result
Drawing graphs is easy using the FX9750GII! They can be drawn in the RUN-MAT or GRAPH icons.
RUN-MAT icon
The functions (and more) listed below (and there are
many more) have been ‘installed’ into the calculator
for quick graphing. Each has its own unique pre-set
domain and range values.
The graph as it appears on the screen gives a clear idea of the shape but no indication of the values on the horizontal
or vertical axis, except for ------+------ marks on the axes.
Note: There is no
need to include the
‘x’.
To nd information on a graph’s scale
View the domain and range values in V-Window.
This display tells the user that on the x-axis the scale is 2, and
hence the marks on the x-axis are 0, 2, 4, 6, 8, 10. The y-axis has
a scale of 1 and hence the marks on the y-axis are -1, 0, 1, 2, 3, 4.
KEY
RESULT

 Loading...


