CHAPTER 2 | PG 15
Clearing the screen [Cls]
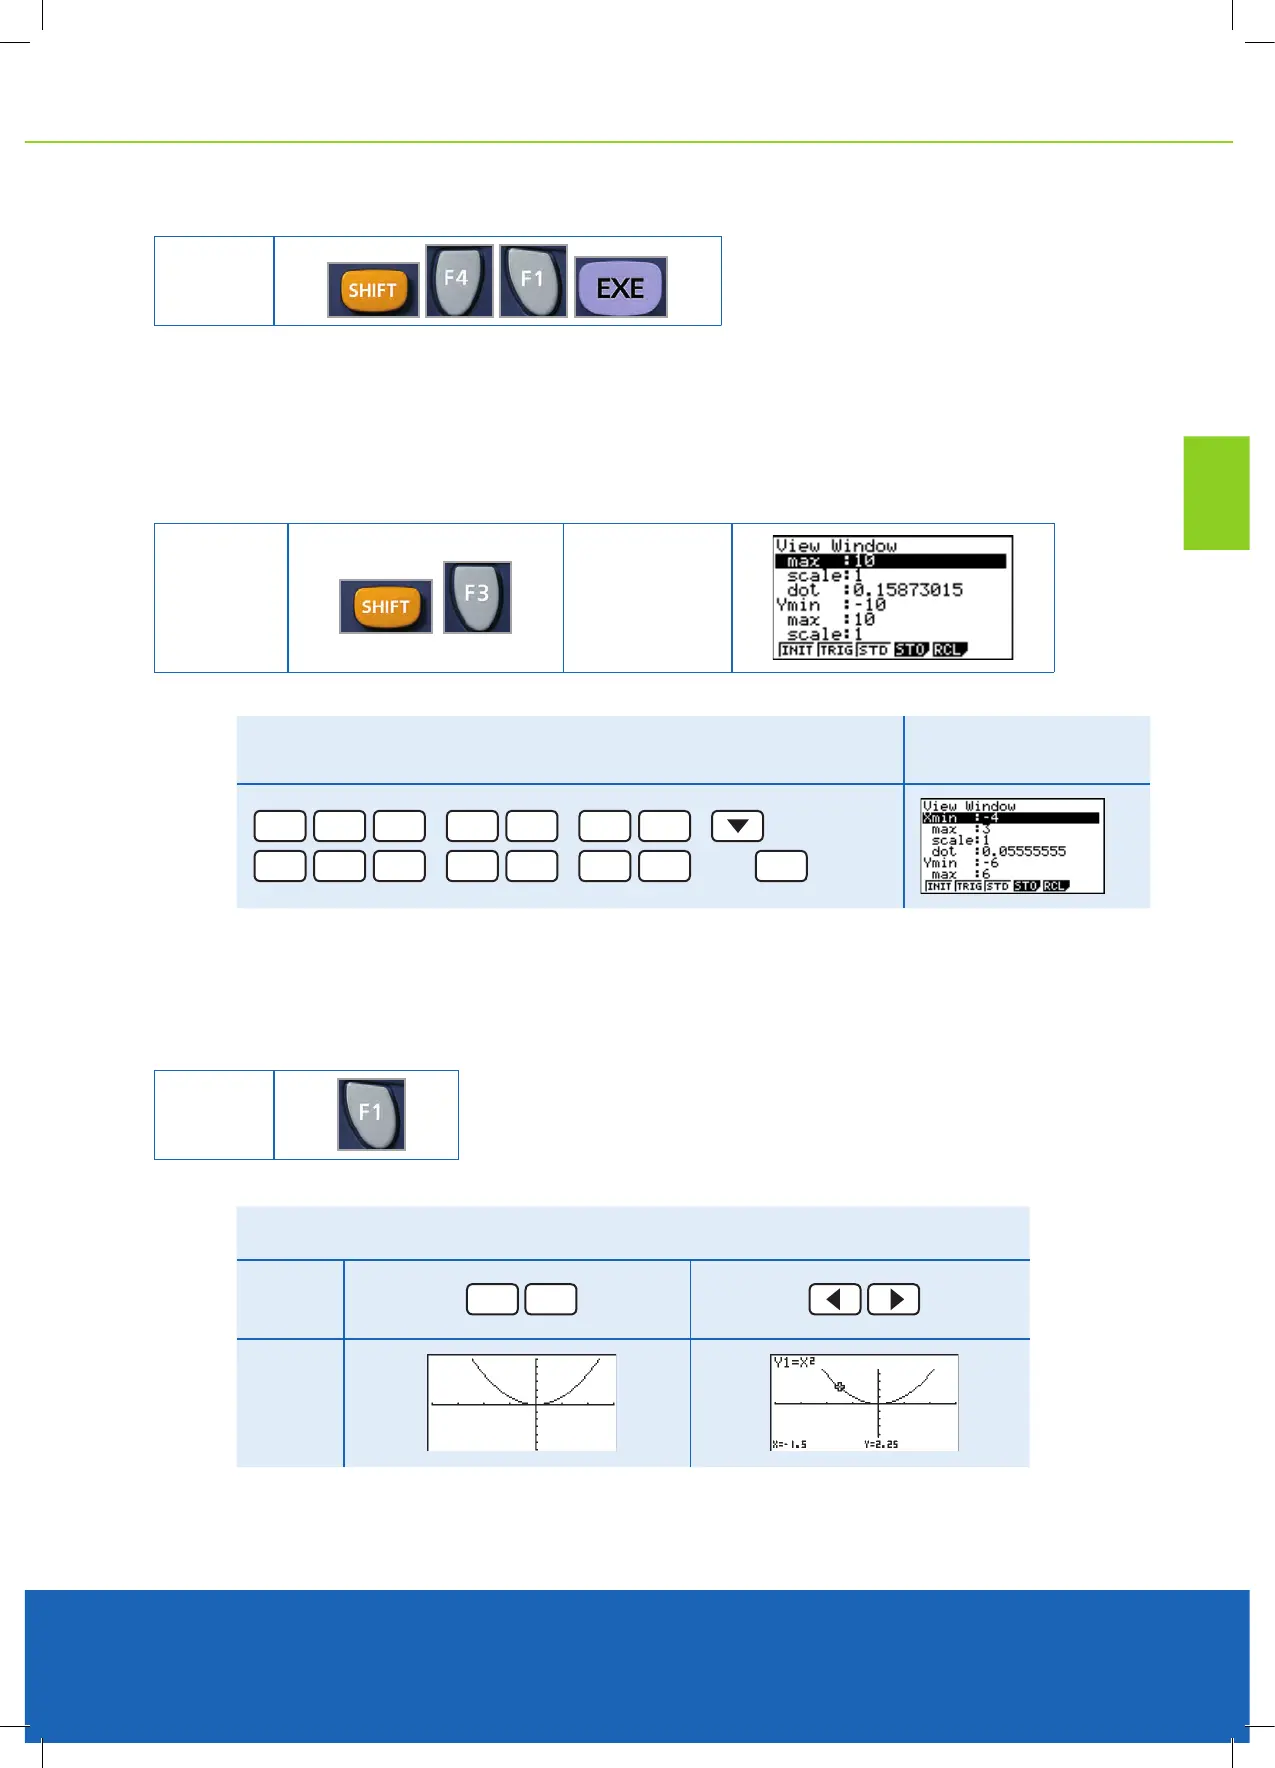
Graphs that need to have the Domain and Range edited
Changing the values in the V-Window is easily executed. Single editing or pre-set [F1] [F2] [F3].
Varying the Domain and Range is a necessary skill when developing the connections between the graphical,
symbolic and numerical aspects of equations.
Tracing functions
Note: Numerous graphs can be superimposed, allowing linear programming.
Separating each graph equation with a ‘ : ’ (colon) provides functions that can be traced and if necessary zoomed in
on to nd vertices that dene the feasible region (points of intersections) etc.
After each graph has been drawn then [SHIFT]
[F4] [F1]
key followed by
[EXE] is necessary to
clear the previously drawn graph, otherwise the
graphs will be superimposed.
Using the left and right arrows the user can trace over the graph and give accurate x and y values of many points
on the curve.
KEY
RESULT
Example
For the graph y = (x - 1)/(x + 2) a suitable range could be -4 < x < 3 and
-6 < y < 6
Result
-
4
EXE
,
3
EXE
,
1
EXE
, ,
-
6
EXE
,
6
EXE
,
1
EXE
then
EXIT
Example
For the graph y = x^2, (i.e. y = x
2
) a suitable range could be -4 < x < 3 and -6 < y < 6.
Key
SHIFT
F1
Result
KEY
KEY
The interpretation of the graphed functions is supplemented by the use of the
Trace key. The (x, y) values of points on the curve are displayed underneath
the drawn graph.

 Loading...


