Zooming in and out
The ‘zooming’ is easily initiated when parts of a graph need to be seen in more detail - ‘roots’ to the equation,
maximum or minimum points or other aspects under investigation.
Plotting points
Plotting points from tables for example is easy to do, as is drawing a line between these points.
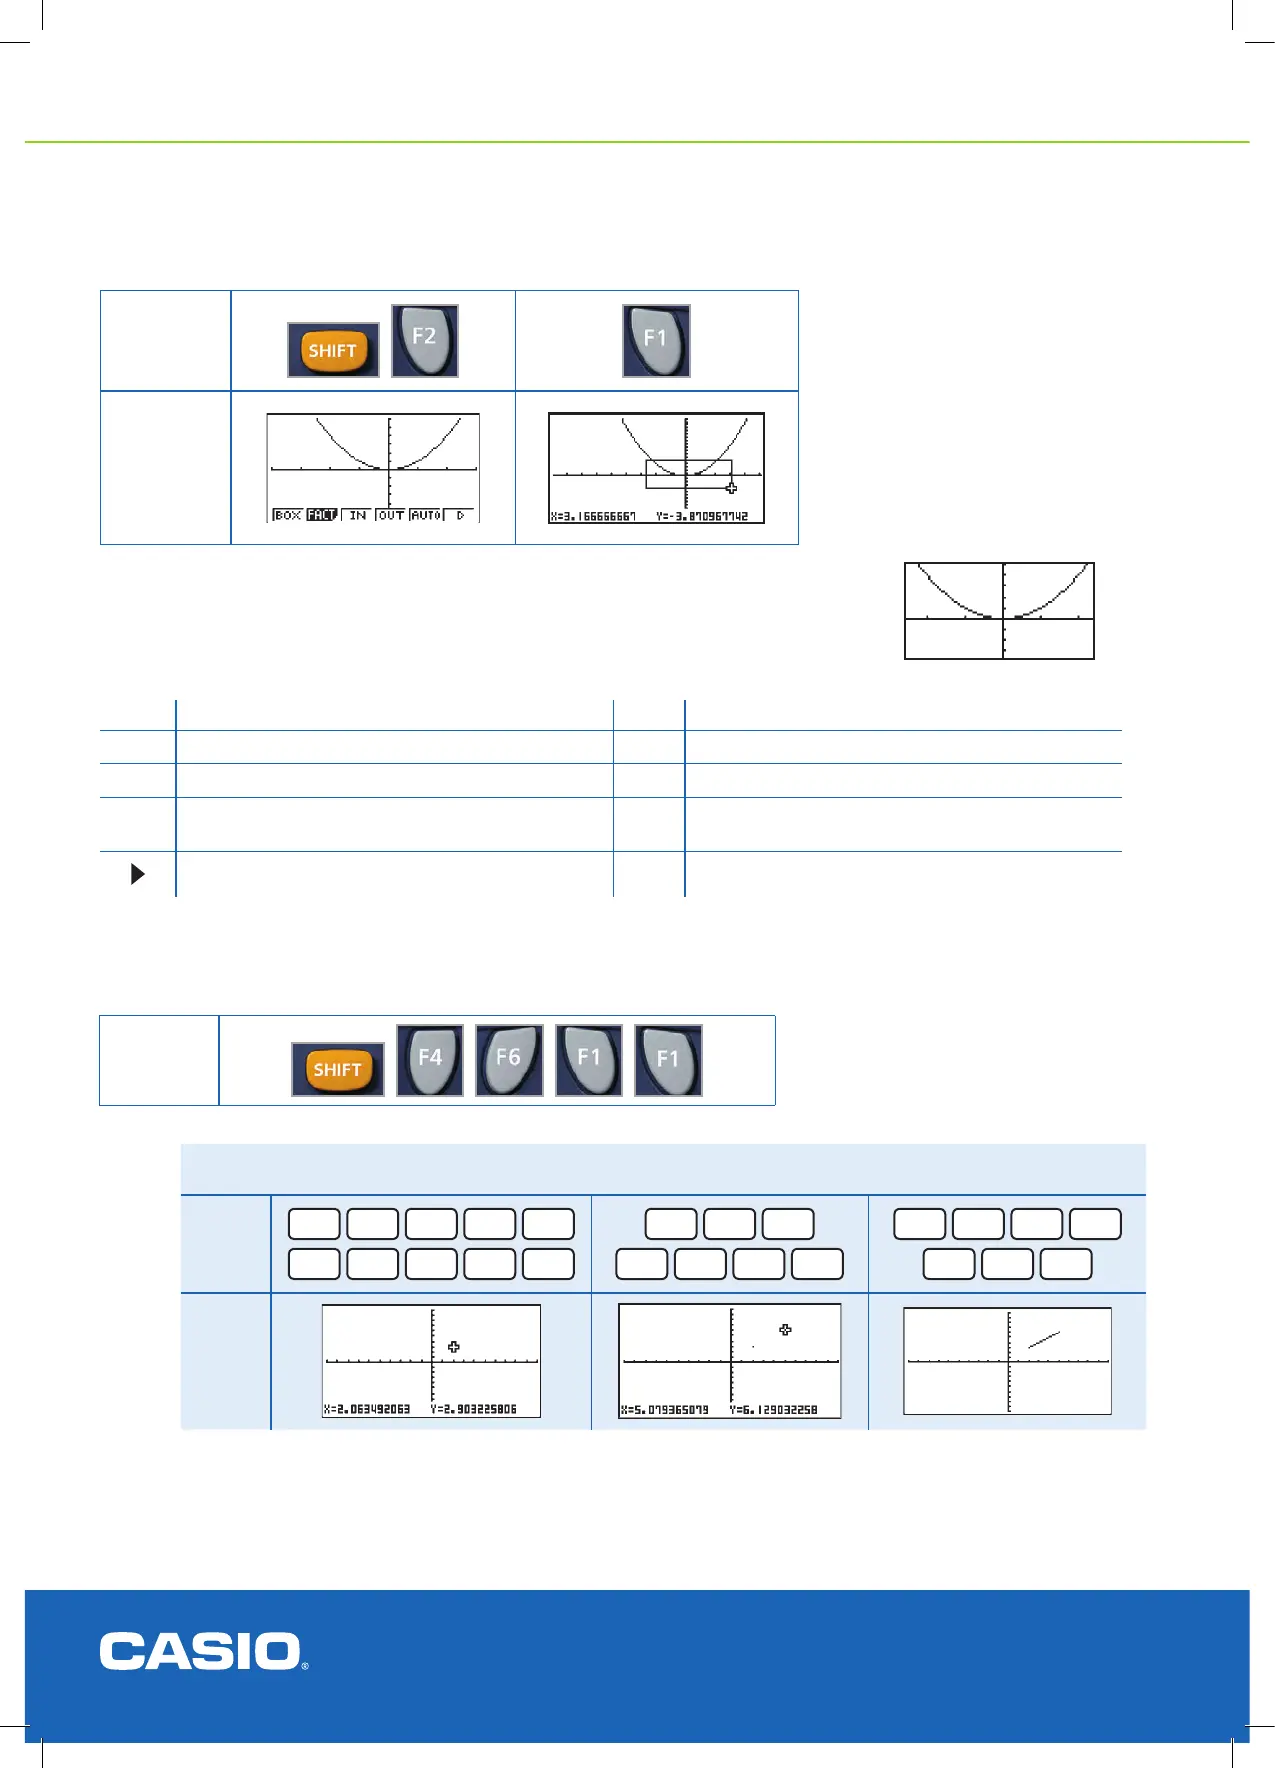
By choosing BOX [F1] you can decide what ‘new’ domain and range values will be used
for the V-Window. To make the BOX use the arrows to determine where a vertex of the
BOX is to be then [EXE]. Use the arrows again to complete the BOX. When you are
satised with its position, press [EXE] and the new view window will be drawn.
Note:
1. The V-window will determine how ‘close’ the point being plotted is. The dimensions of the screen are 123 pixels wide
and 63 pixels deep. This is determined by the INITial settings in the V-window. More about the V-window settings later
(see index at back of book).
2. In the RUN-MAT icon you do not have access to the G-Solve features.
Note: The different ‘menu bars’ as listed below.
FACT Scale factor for V-Window for IN ORIG The original graph drawn before zooming in or out
IN The calculator will zoom in on centre of screen SQR
OUT The calculator will zoom out on centre of screen RND
AUTO
The calculator will calculate what it thinks best for
the graph to be drawn
INTG
Next selection window PRE
Example
Plot the points 2, 3 & 5, 6
Key
SHIFT
F4
F6
F1
F1
2
,
3
EXE
EXE
F6
EXE
F1
5
,
6
EXE
EXE
SHIFT
F6
EXIT
F2
F1
EXE
Result
KEY
RESULT
KEY