CHAPTER 2 | PG 17
GRAPH icon
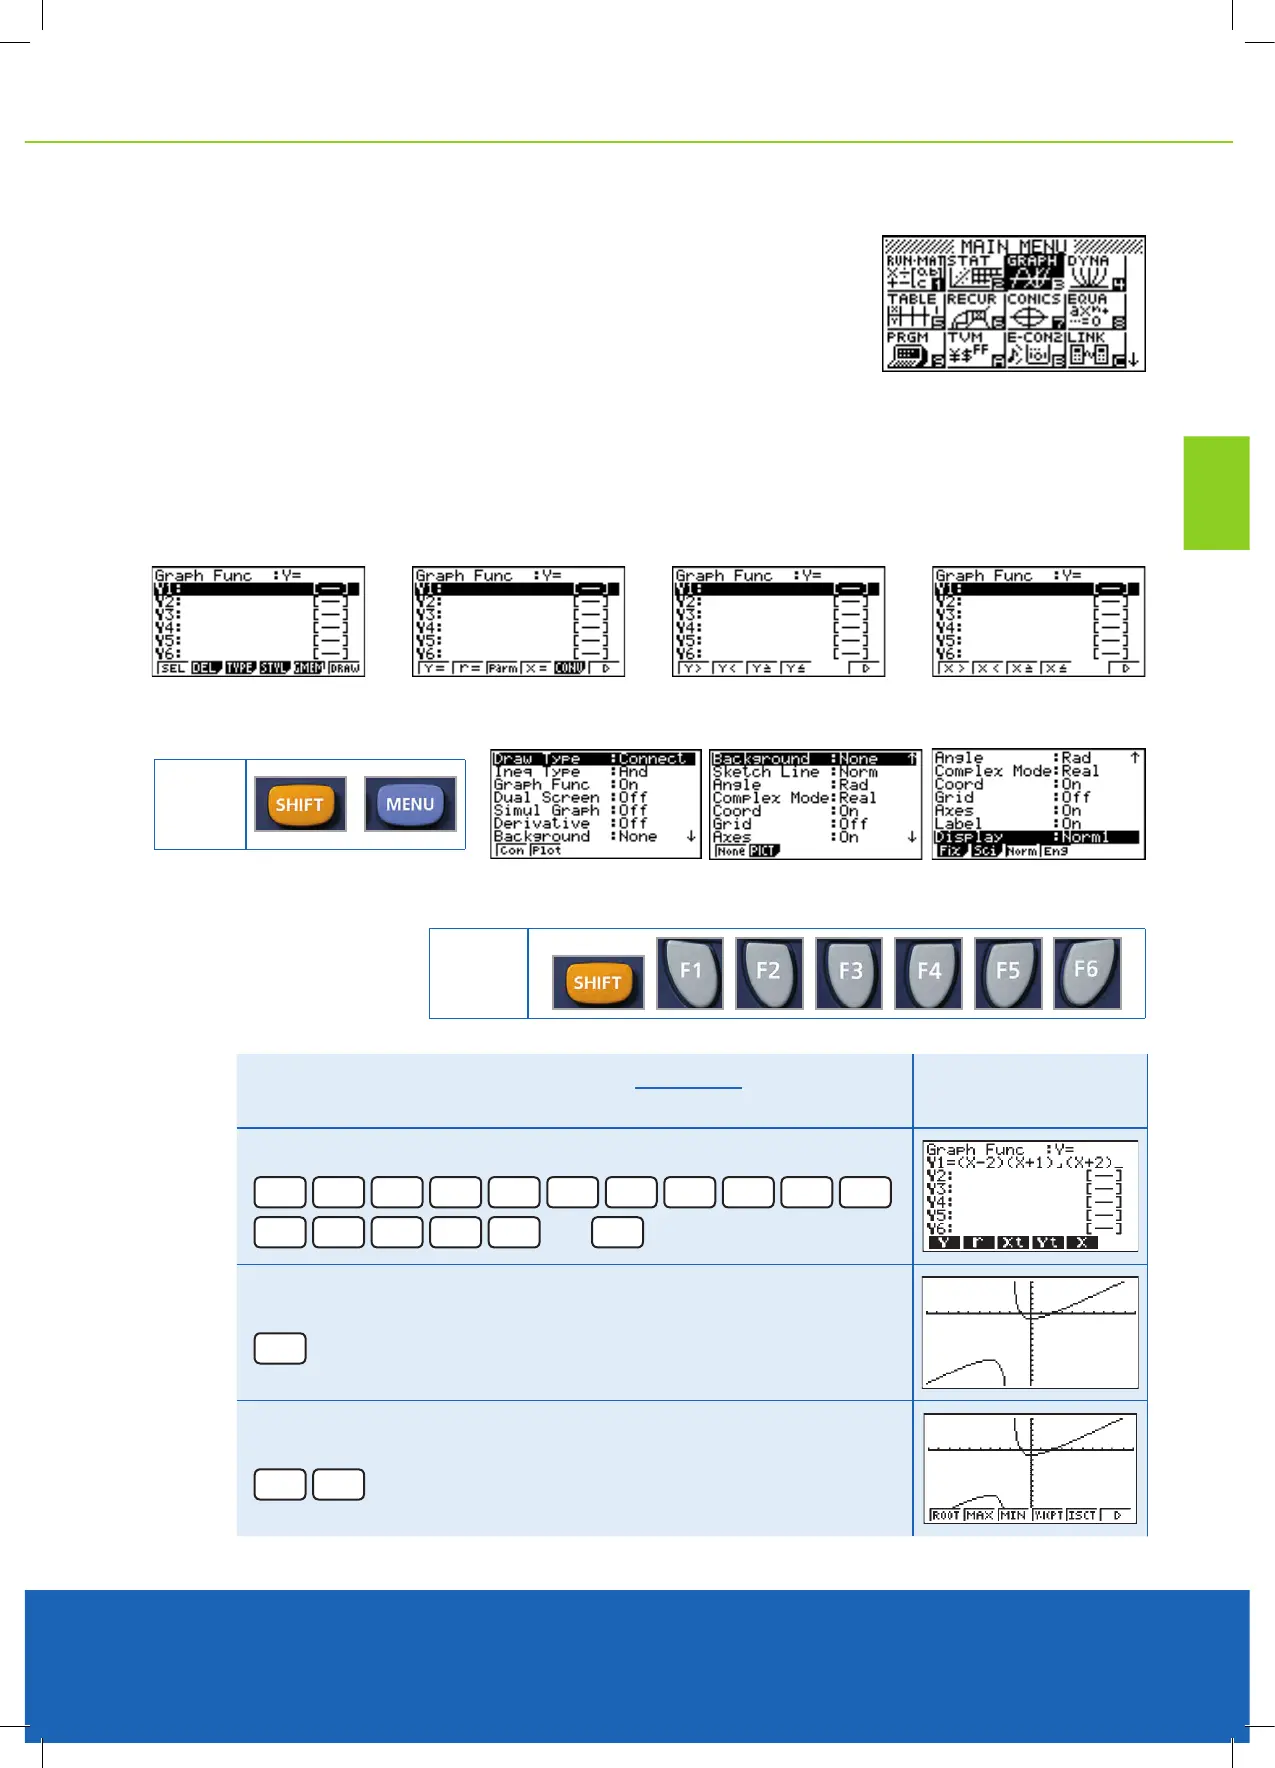
From the MAIN MENU enter into the GRAPH icon by either moving the cursor to
highlight the icon or pressing the [3] key.
This part of the calculator has a lot of functionality. Stores graphs, up to 20
functions that you use regularly or ‘families’ of graphs where relationships and
special features can be viewed.
All of the ‘Function’ key menus, such as Trace, Zoom, V-Window, Sketch, Graphical Solutions and Graph - Text
are also available. It is also where you can view Graph - Graphs and Graph - Table split screens. The screen is split
vertically, giving very good views of what you have chosen to see.
You can draw equations and in-equations, rectangular, parametric and polar graph types. By selecting [F3] you can
view the different types.
How to chose the calculator settings (Set Up)
G-Solve features
Once you have drawn a graph
then you have access to the
G-Solve features.
cont. on next page
KEY
KEY
Example
Collate information about the function y =
(x-2)(x+1)
Result
(x+2)
Store the expression in position Y1
(
X,
θ
,T
-
2
)
(
X,
θ
,T
+
1
)
a
b
/c
(
X,
θ
,T
+
2
)
then
EXE
Draw the graph
F6
Open the G-Solve selections
SHIFT
F5
 Loading...


