Basic activities in the GRAPH icon
Other G-Solve features are shown in other chapters in this book where appropriate.
This activity shows how the calculator can be used: to draw multiple lines; to see the relationship to the change in
the constant ‘c’ in y = mx + c and to draw multiple parabolas; to see the relationship to the change in the coefcient
‘a’ in y = ax
2
+ c.
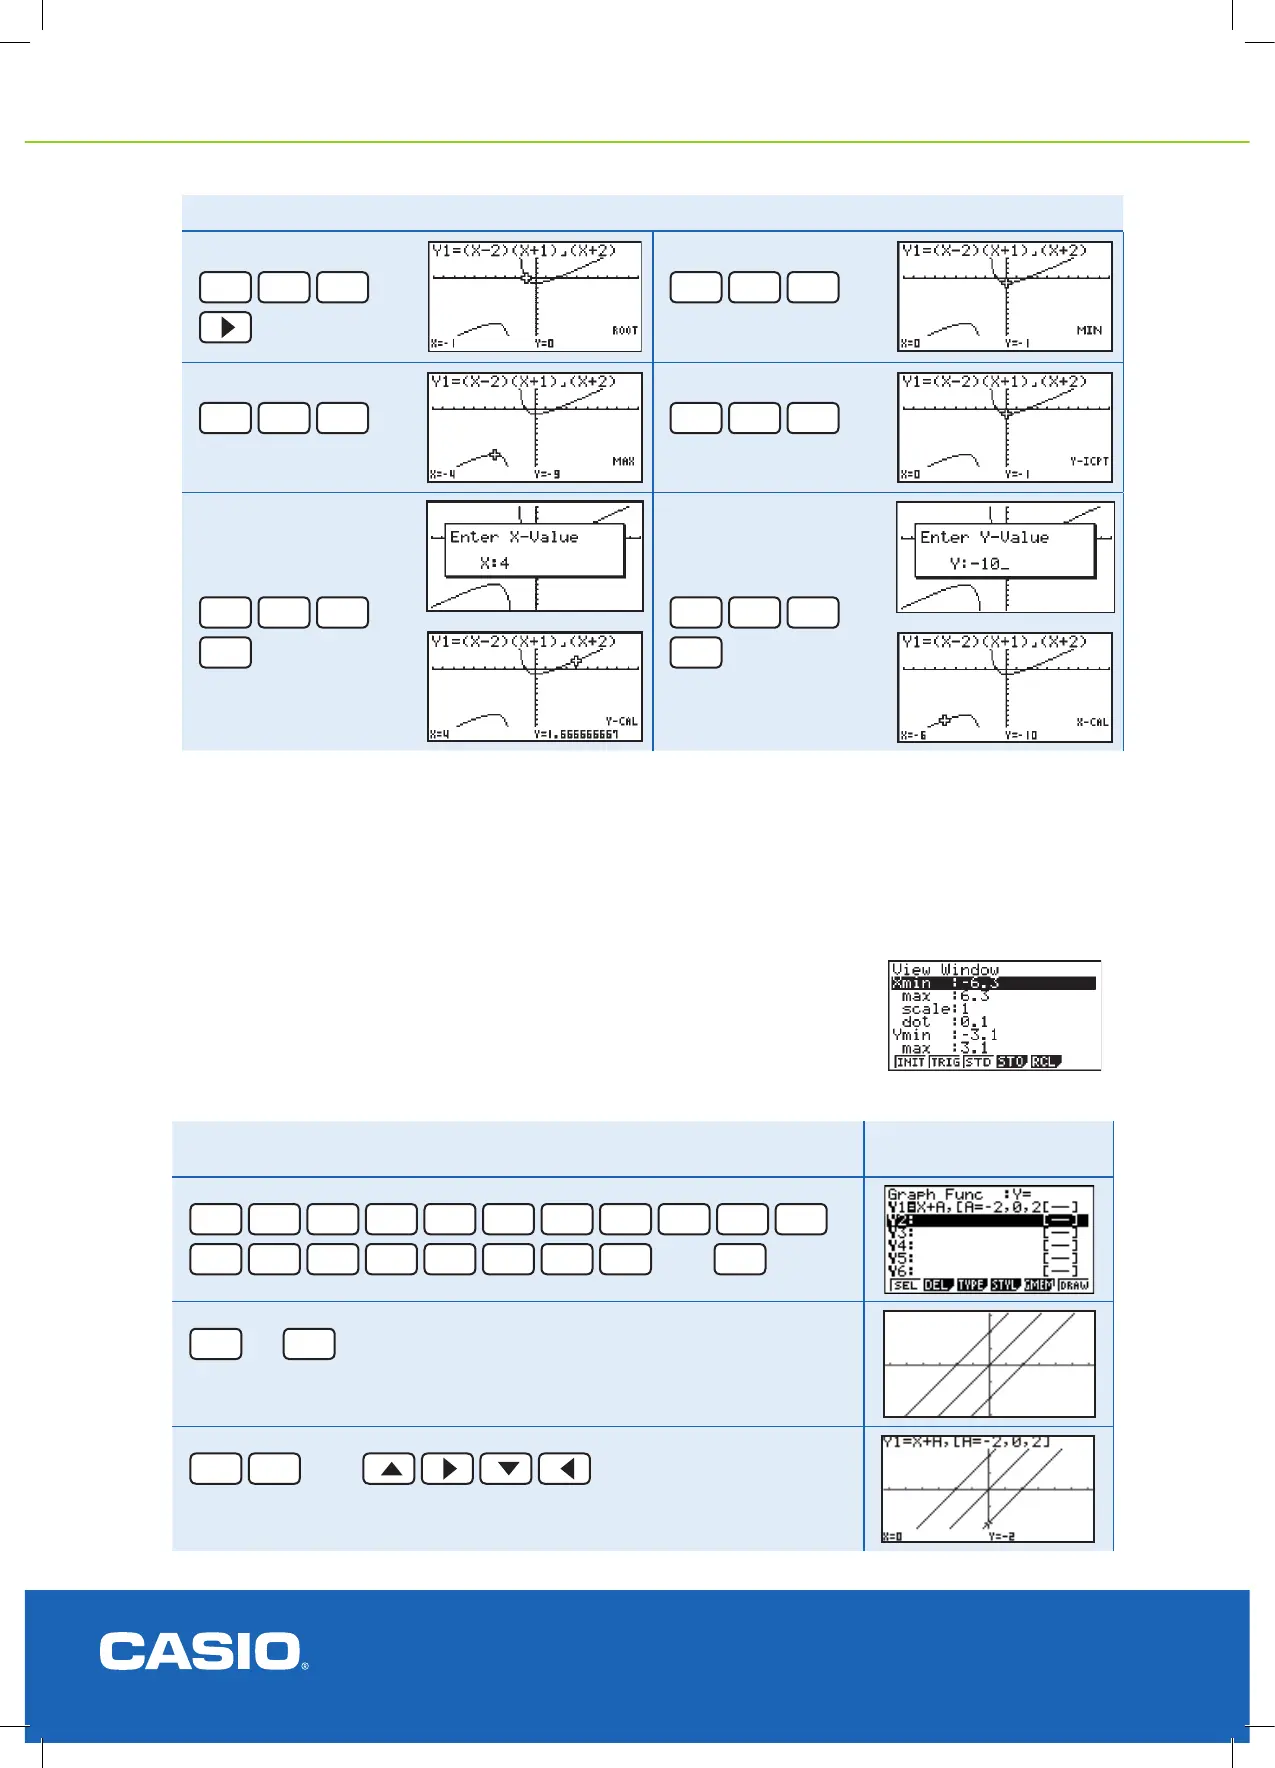
A line - multiple representations for y = x + c
Note:
Make sure that the V-Window is appropriate to see the graphs that you will be drawing.
Enter [SHIFT] [F3] then the option that you require, in this case, [F1] for INITial. Go
back to the Graph Function menu with [EXIT] or [EXE].
Using, [A=-2,0,2] at the end if the equation gives the static effect of a ‘dynamic graph’.
Example
Draw the graphs of y = x - 2, y = x, y = x + 2 Result
X,
θ
,T
+
ALPHA
X,
θ
,T
,
SHIFT
+
ALPHA
X,
θ
,T
SHIFT
.
-
2
,
0
,
2
SHIFT
-
then
EXE
EXE
or
F6
You will see these lines drawn one at a time.
SHIFT
F1
then
‘Trace’ either of the three graphs.
Find the...
Root/s
SHIFT
F5
F1
Minimum
SHIFT
F5
F3
Maximum
SHIFT
F5
F2
Y-intercept
SHIFT
F5
F4
Y-value calculations
SHIFT
F5
F6
F1
X-value calculations
SHIFT
F5
F6
F2