CHAPTER 2 | PG 19
A parabola - multiple representations for y = ax
2
Note:
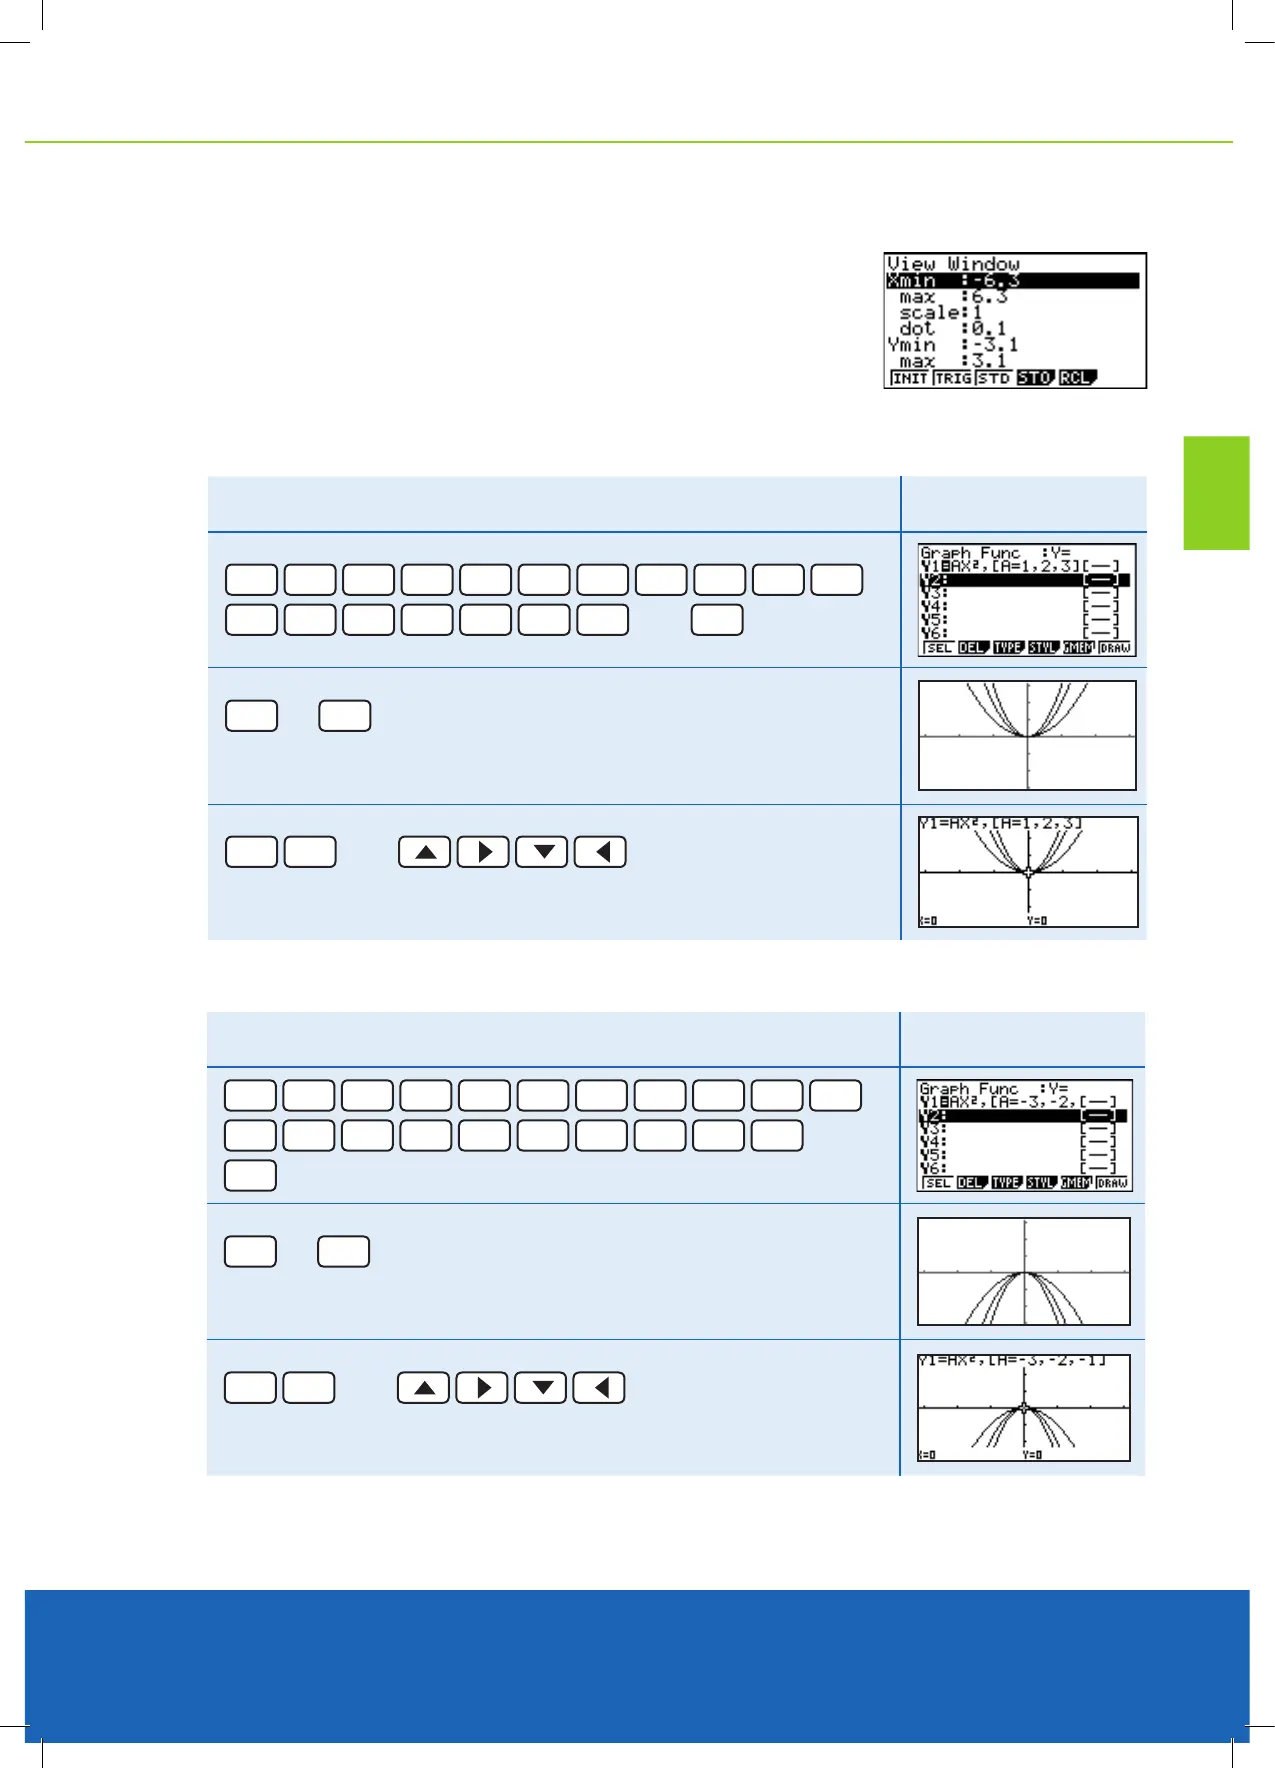
Make sure that the V-Window is appropriate to see the graphs that you will be
drawing. Enter [SHIFT] [F3] then change the settings to the conditions shown here.
Go back to the Graph Function menu with
[EXE] or [EXIT]
.
Using, [A=1,2,3] at the end if the equation gives the effect of a ‘dynamic graph’.
Example
Draw the graphs of y = 1x
2
, y = 2x
2
, y = 3x
2
Result
ALPHA
X,
θ
,T
X,
θ
,T
x
2
,
SHIFT
+
ALPHA
X,
θ
,T
SHIFT
.
1
,
2
,
3
SHIFT
-
then
EXE
EXE
or
F6
You will see parabolas being drawn one at a time.
SHIFT
F1
then
‘Trace’ either of the three graphs.
Example 2
Draw the graphs of y = -1x
2
, y = -2x
2
, y = -3x
2
Result
ALPHA
X,
θ
,T
X,
θ
,T
x
2
,
SHIFT
+
ALPHA
X,
θ
,T
SHIFT
.
-
3
,
-
2
,
-
1
SHIFT
-
then
EXE
EXE
or
F6
You will see parabolas being drawn one at a time.
SHIFT
F1
then
‘Trace’ either of the three graphs.
 Loading...


