Piecewise Functions
Note:
Piecewise functions are pieces of different functions, restricted in the domain (x-values) for which they are to be drawn.
Use [ , ] to restrict the domain values.
You can ‘trace’ over the graphs by pressing [SHIFT]
[F3] then use the arrows
to scroll each of
the graphs on the screen.
Graph drawing – Zooming in and out
When the V-Window (Graph Viewing Window) has
not been set up for the graph that you want to see,
your screen will look like either of the following images.
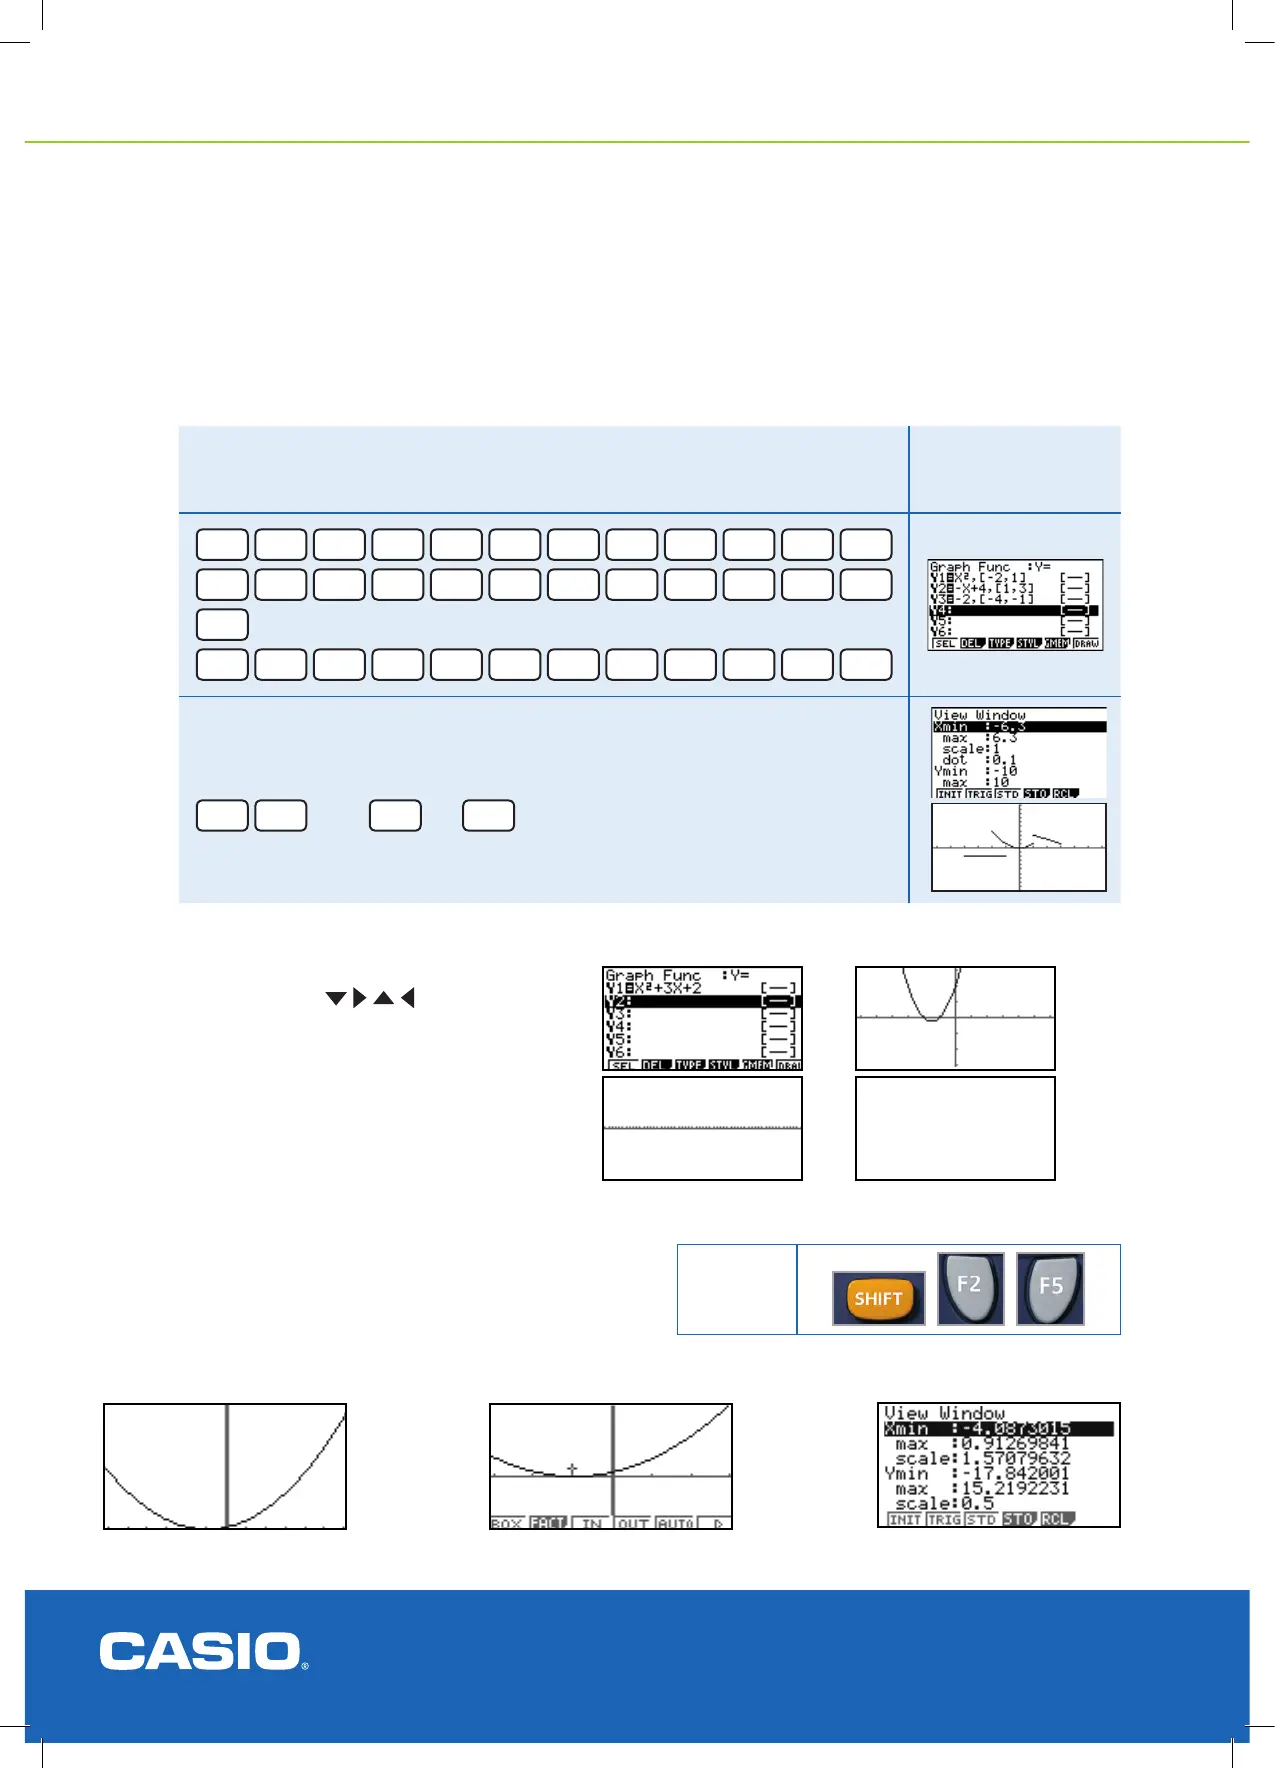
Example
Draw the graphs of y = x², -2 ≤ x ≤ 1
y = -x + 4, 1 ≤ x ≤ 3
y = -2, -4 ≤ x ≤ -2
Result
X,
θ
,T
x
2
,
SHIFT
+
-
2
,
1
SHIFT
-
EXE
-
X,
θ
,T
+
4
,
SHIFT
+
1
,
3
SHIFT
-
EXE
-
2
,
SHIFT
+
-
4
,
-
1
SHIFT
-
Set up the V-Window and then draw the graphs.
SHIFT
F3
then
EXE
or
F6
Auto Zoom
Using the AUTO ZOOM the calculator will adjust the axes so
that you can see ‘your graph’ better then you can adjust the
V-Window to a more appropriate scale to suit what you want.
KEY
If you want to, change the View-Window to ‘zoom’ in on the graphs, to get a better picture (view).
To get AUTO ZOOM press [SHIFT] [F2] and then [F5]
.
A cursor appears in the middle of the screen. You can move it to the left, right, up or down to adjust the axes the
[EXE]
to redraw.
cont. on next page
Basic activities in the GRAPH icon cont.
 Loading...


