CHAPTER 2 | PG 23
Solving trigonometric equations
It is necessary to check that the domain (x-coordinates) and range (y-coordinates) are set up for graphing trigonometric
graphs, through the V-Window ( [SHIFT] [F3]).
By pressing the [F2] key this sets the calculator up for
TRIGonometric graphs. You can alter the settings by
overriding what is already there.
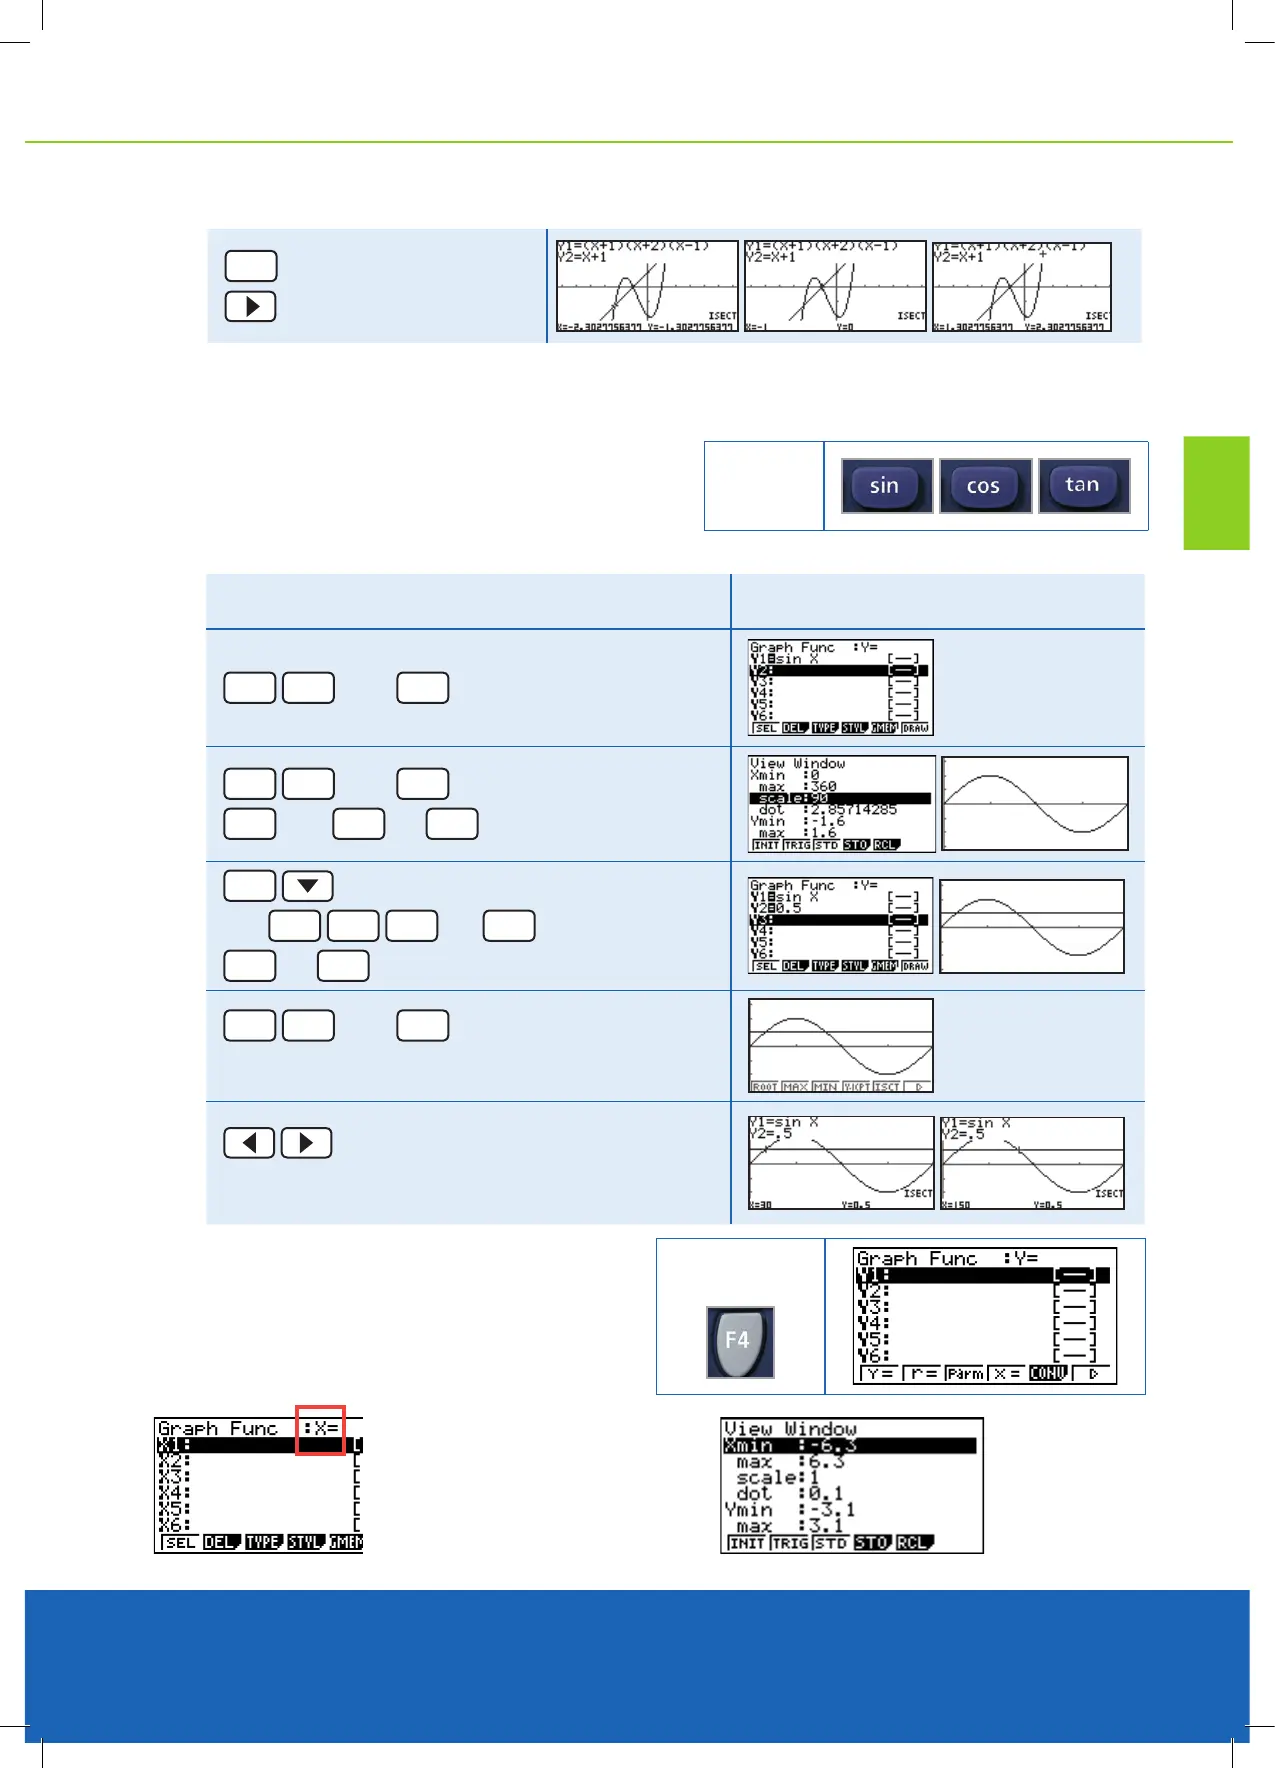
Example
Solve sin x = 0.5 between 0º ≤ x ≤ 360º Result
sin
X,
θ
,T
then
EXE
SHIFT
F3
then
F2
Set up for TRIG graphs
EXIT
then
EXE
or
F6
to draw the sine curve
EXIT
into Y2
then
0
.
5
and
EXE
to store
EXE
or
F6
to draw both graphs
SHIFT
F5
then
F5
for G-Solve (solves the two graphs simultaneously)
Search for the next solution
The two solutions are x = 30 and 150
KEY
Solving ‘X=…’ equations.
x = y entry rather than y = x in GRAPH mode.
Selecting TYPE [F3] gives you access to a number
of different graph types that can be drawn.
For “X =”
Note:
That the Graph Function at the top
of the screen changes to : X=
To enter in ‘Y’ use the [ALPHA] key
and then the [ — ] key
Use this
V-Window.
Example cont.
F5
for ISCT (intersection points)
to nd all others