CHAPTER 4 | PG 33
Uni-variate cont.
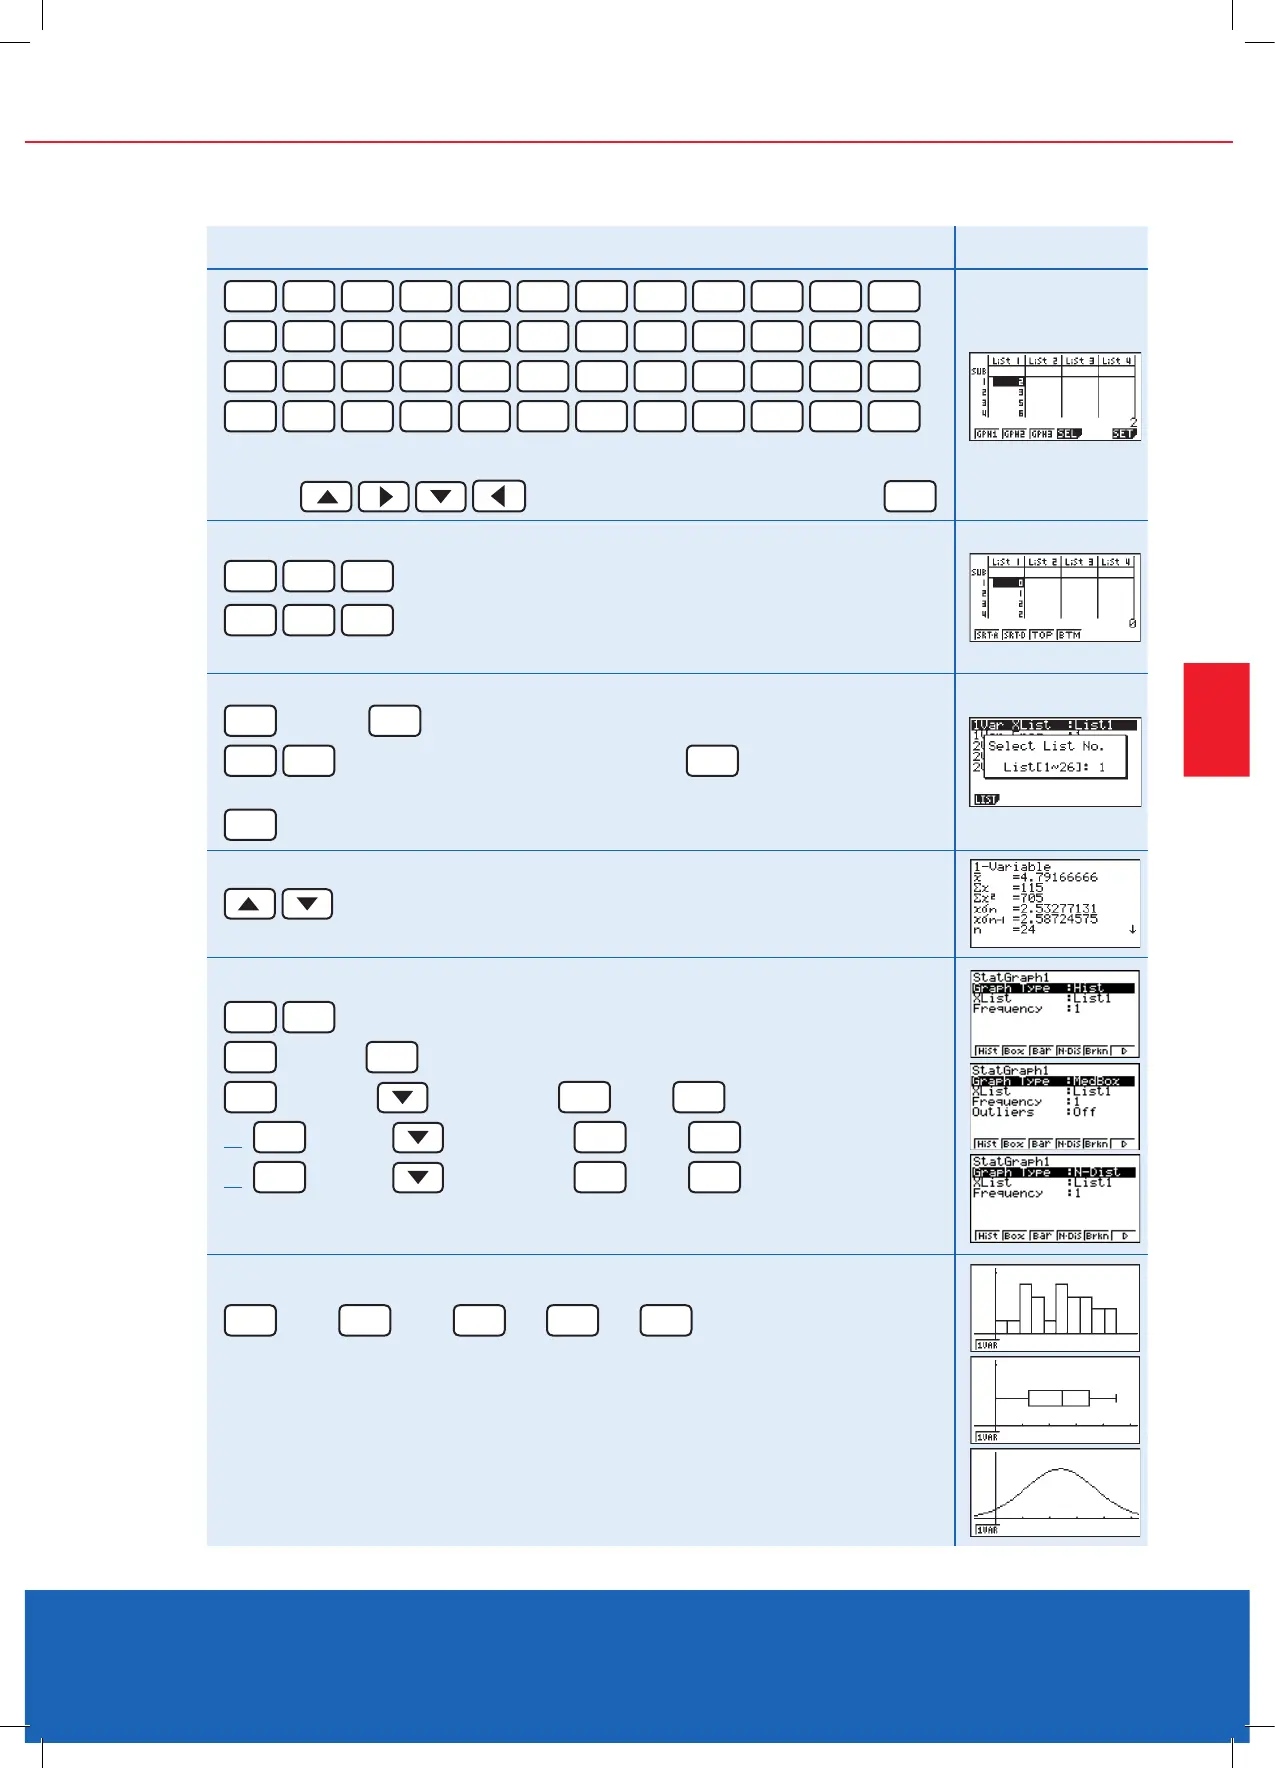
Example cont.
Result
2
EXE
3
EXE
5
EXE
6
EXE
8
EXE
7
EXE
5
EXE
3
EXE
2
EXE
9
EXE
7
EXE
4
EXE
2
EXE
1
EXE
0
EXE
9
EXE
6
EXE
8
EXE
5
EXE
3
EXE
7
EXE
6
EXE
2
EXE
5
EXE
Note: Wrongly entered scores can be edited by moving to the appropriate cell
with the
and typing over the score and pressing
EXE
Sorting data entries:
F6
F1
F1
Ascending (lowest to highest) (SRT-A)
F6
F1
F2
Descending (highest to lowest) (SRT-D)
Enter how many list(s) to sort and then which list(s)
Calculate statistics for this set of scores:
F2
[CALC]
F6
[SET]
F1
1
Set the list to be calculated from then
EXIT
Make sure “1Var Freq” is set to 1
F1
[1 VAR] for the calculated statistics
Scroll through the complete set of calculated statistics
You can now set up the calculator to draw the statistical graphs
EXIT
F6
to return to the main screen
F1
[GRPH]
F6
[SET]
F1
[GRPH1]
[Graph Type]
F6
then
F1
[HIST]
or
F2
[GPH2]
[Graph Type]
F6
then
F2
[BOX]
or
F3
[GPH3]
[Graph Type]
F6
then
F4
[N-Dis]
Note: You can set up any graph in any of the three [GRAPH] spaces
EXIT
then
F1
then
EXE
or
F2
or
F3
Graph/s have been drawn
Note: Lists (data) can be copied, sorted, altered and placed into other ‘list’ areas.