Uni-variate cont.
Example 2
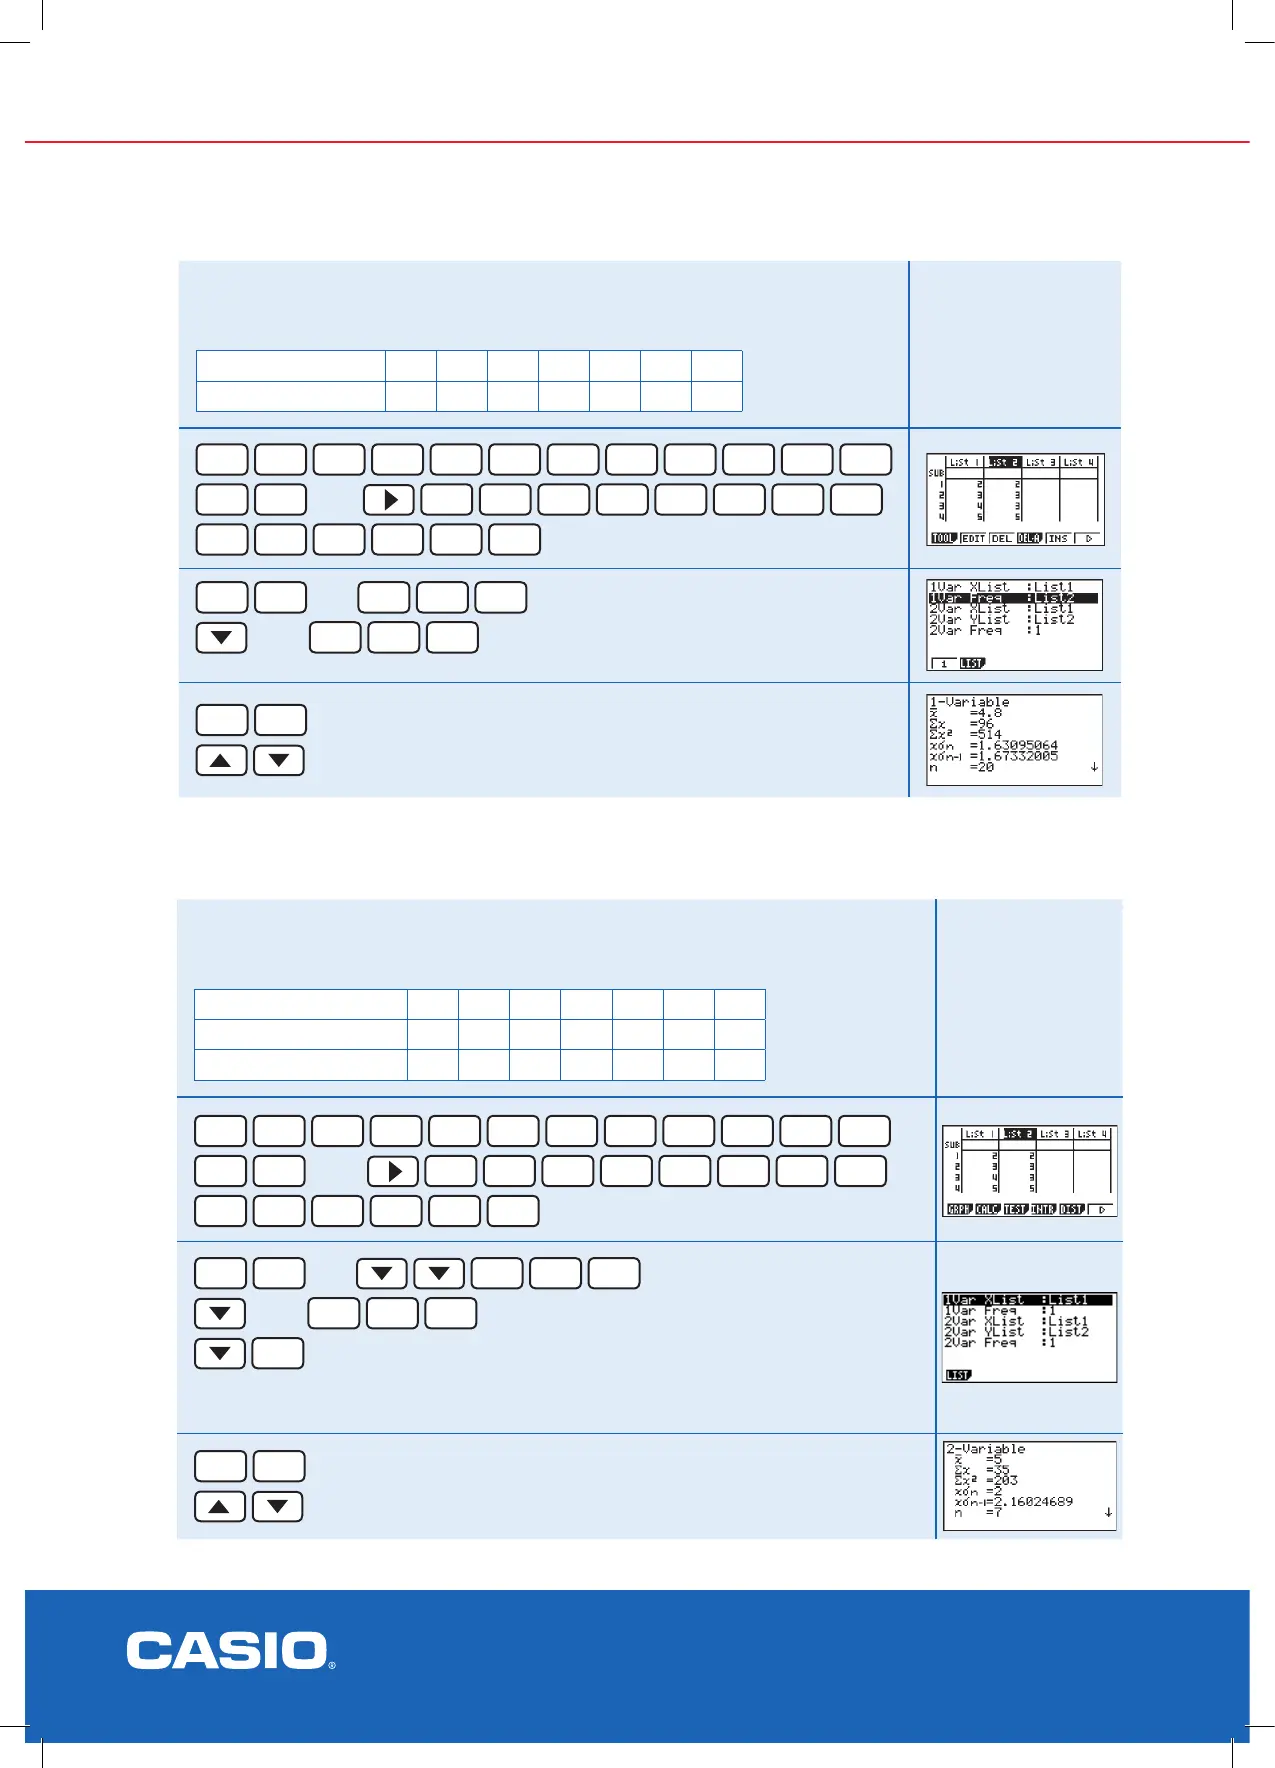
Enter the following data into list 1 and list 2 spaces to calculate summary
statistics from given data. Set up the lists so the List 1 is the x-values, List 2 is
the frequency values.
Score x - List 1 2 3 4 5 6 7 8
Frequency f - List 2 2 3 3 5 4 2 1
Result
2
EXE
3
EXE
4
EXE
5
EXE
6
EXE
7
EXE
8
EXE
then
2
EXE
3
EXE
3
EXE
5
EXE
4
EXE
2
EXE
1
EXE
F2
F6
then
F1
1
EXE
List 1 is now entered as the x-values
then
F2
2
EXE
List 2 is now entered as the frequency
EXIT
F1
Summary statistics
Scroll through the complete set of calculated statistics
Bi-variate data
Example
Enter the following 2 variable statistics and graph a linear regression model of
the data. Set up the lists so the List 1 is the Mathematics (x-values), List 2 is the
English (y values).
Student a b c d e f g
Mathematics x - List 1 2 3 4 5 6 7 8
English y - List 2 2 3 3 5 6 7 6
Result
2
EXE
3
EXE
4
EXE
5
EXE
6
EXE
7
EXE
8
EXE
then
2
EXE
3
EXE
3
EXE
5
EXE
6
EXE
7
EXE
6
EXE
F2
F6
then
F1
1
EXE
List 1 is entered as the x-values
then
F1
2
EXE
List 2 is entered as the y-values
F1
Frequency is set at 1
Data has been set up to calculate in regression format.
Note: This calculator model performs a Least Squares regression model
EXIT
F2
Summary statistics
Scroll through the complete set of calculated statistics
cont. on next page