CHAPTER 4 | PG 35
Example 2
Enter the following two variable statistics and graph a linear regression model for
the data. Set up the lists so the List 2 is the x-values, List 3 is the y-values and List
4 is the frequency.
Student a b c d e f g
Mathematics x - List 2 2 3 4 5 6 7 8
English y - List 3 2 3 3 5 6 7 6
Frequency f - List 4 1 2 1 1 3 2 1
Result
2
EXE
3
EXE
4
EXE
5
EXE
6
EXE
7
EXE
8
EXE
then
2
EXE
3
EXE
3
EXE
5
EXE
6
EXE
7
EXE
6
EXE
then
1
EXE
2
EXE
1
EXE
1
EXE
3
EXE
2
EXE
1
EXE
F2
[CALC]
F6
[SET] then
F1
2
EXE
List 2 is entered
as the x-values
then
F1
3
EXE
List 3 is entered as the y-values
F2
4
EXE
List 4 is entered as the frequency
Data has been set up to calculate in regression format.
cont. on next page
Bi-variate cont.
Example cont.
Result
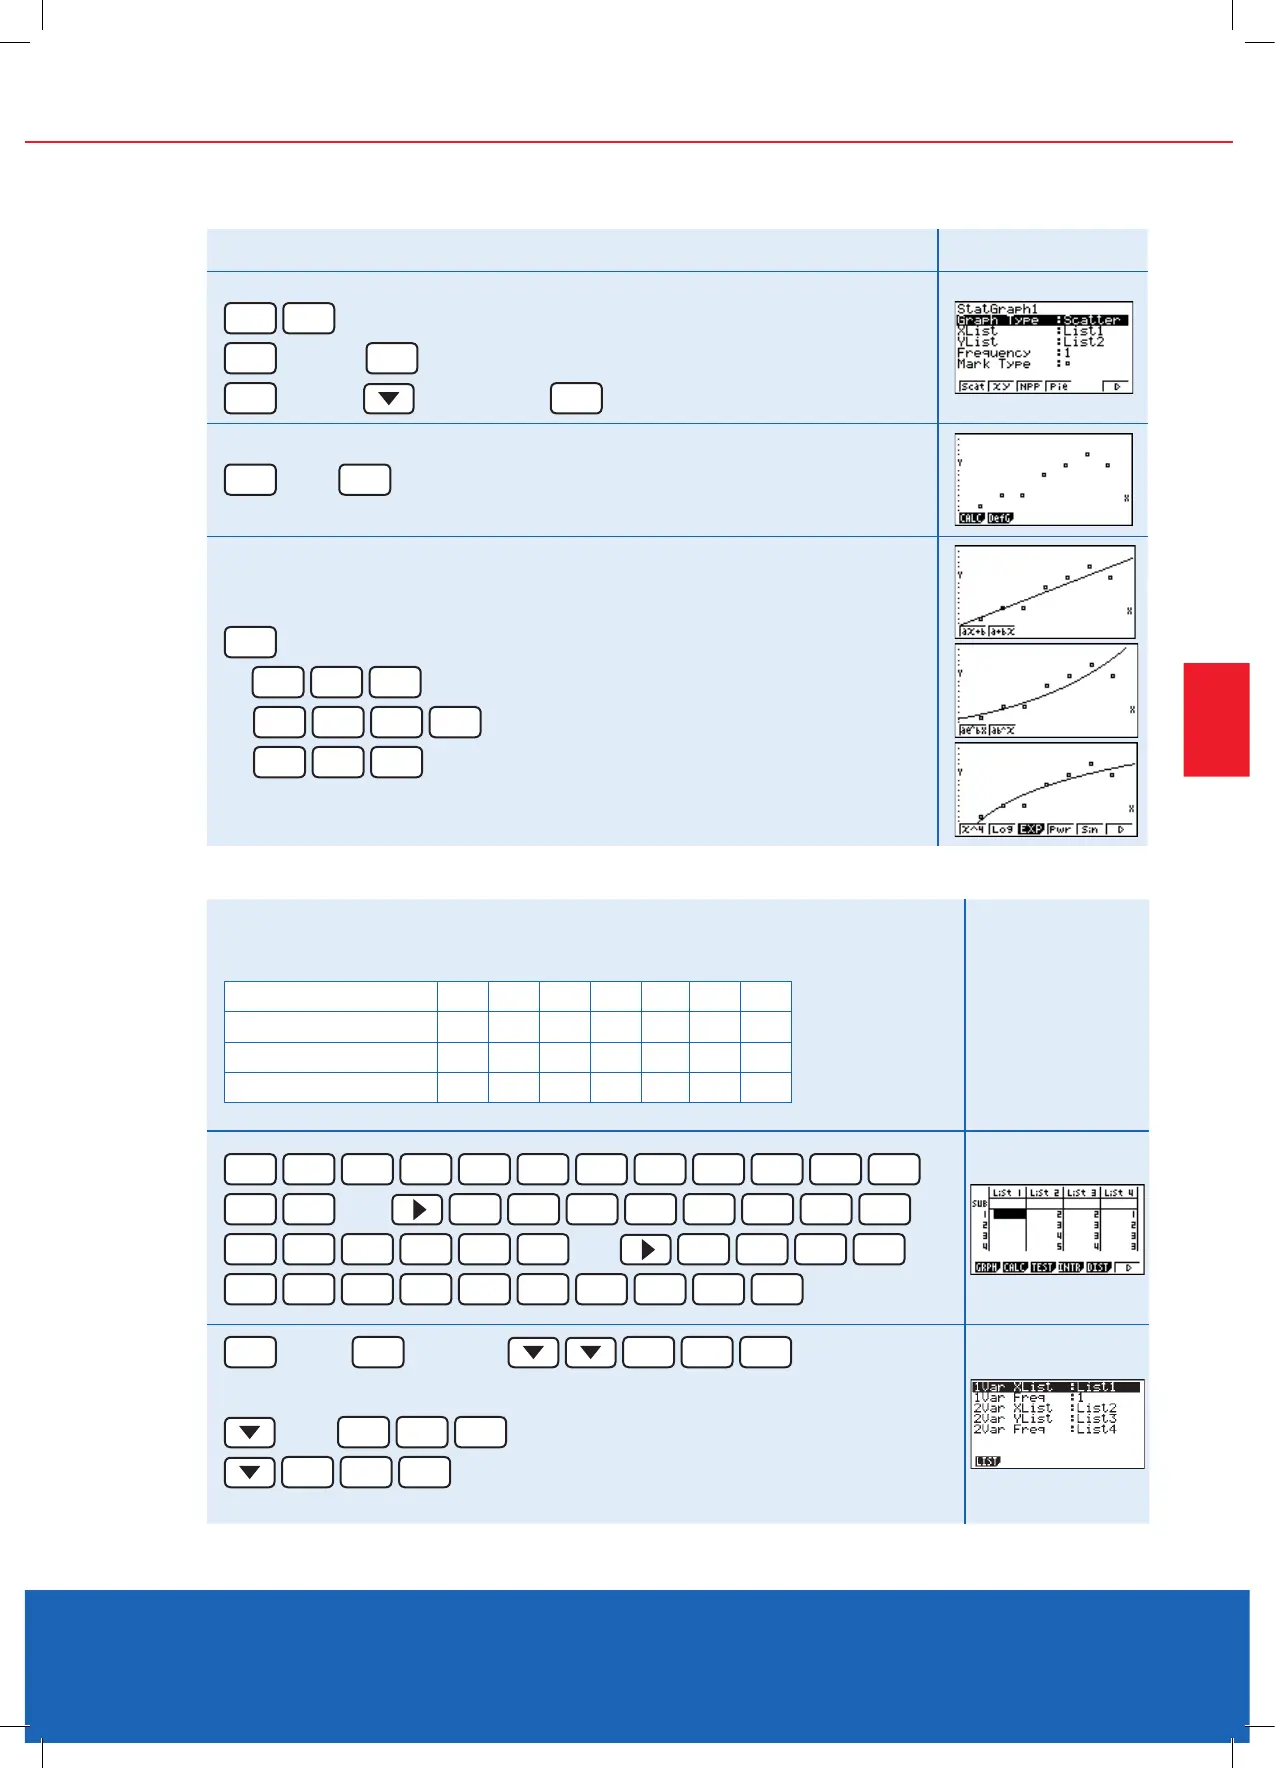
You can now set up the calculator to draw the graph in regression format
EXIT
F6
to return to the main screen
F1
[GRPH]
F6
[SET]
F1
[GPH1]
[Graph Type]
F1
[SCAT]
EXIT
then
F1
Graph has been drawn
Select the mathematical models to t the data points
F1
[CALC]
F2
F1
F6
Linear model
or
F6
F3
F1
F6
Exponential model
or
F6
F2
F6
Logarithmic model