CHAPTER 6 | PG 45
Dyna
Dyna [4] ‘Dynamic Graphs’ can be used to illustrate the changing shapes of selected
functions and varying one of the coefcients in the equation and view the changing
nature of the ‘family of graphs’.
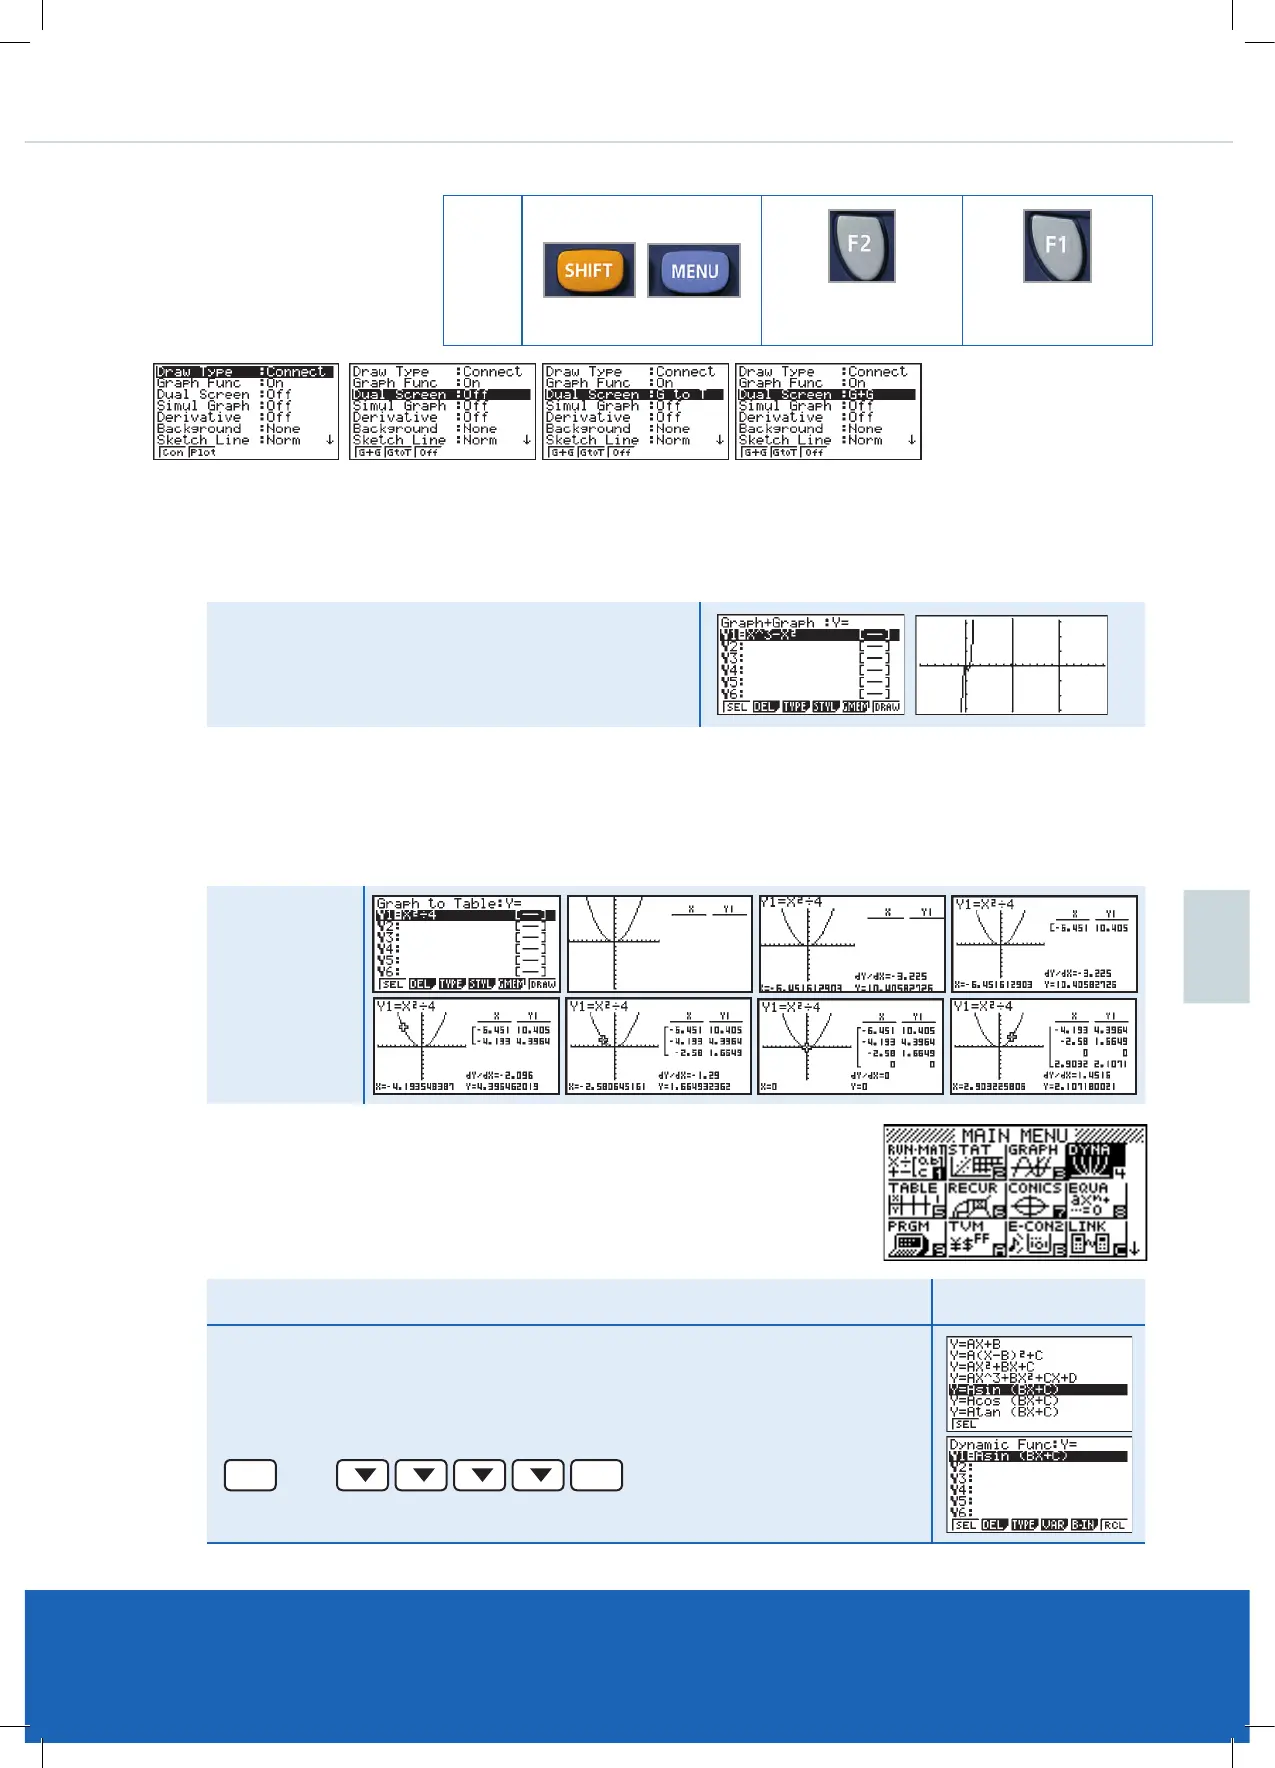
Graph [3] re-visited
The ‘Graph’ mode can also
have Graph - Graph or
Graph - Table. You can
‘toggle’ between the table and
the graph.
Graph - Graph
The Left split screen is the Main screen and the Right split screen is where the ‘zooming’ in/out will be drawn. Hence,
the original graph can be seen as you manipulate the Right screen, for the desired view.
Graph - Table
The Left split screen is the Main screen and the Right split screen is where the x-, y-, and derivative values are
displayed as you ‘Trace’ the graph. When [EXE] is pressed the table values will be generated. These Table values
can be stored as a List ifdesired for further investigation.
KEY
Change dual screen
to ‘G to T’
Change dual screen
to ‘G & G’
Example
Graph y=x
3
- x
2
and view the x-intercepts closely.
Example
Graph y=x
2
÷ 4
and compare
table values to
graph values.
Press [EXE] to
get the table
entry.
cont. on next page
Example
Investigate the differing shape of Y = Asin (1x + 0) Result
Make sure the V-Window [SHIFT] [F3] is appropriate to view the graph(s).
Select the graph type required
F5
(B-In)
EXE