Dyna cont.
Dene the relations The Graph and Text Screens given
Equations
Equations [8] The use of this mode can have you solving simultaneous equations
[F1], up to 6 unknowns or solving quadratic and cubic equations and other polynomials
(up to degree 6) [F2] and the Equation Solver [F3]. This mode of operation is self
explanatory and can be used to investigate Linear Programming, or the relationship
between ‘roots’ of polynomial equations.
Table
Table [7] The use of the ‘Table’ mode can create lists such as a sequence or table
of values generated by a given relationship, a graph of the table or a table and a dual
graph of the table values and table. You can ‘toggle’ between the table and the graph.
Setting the calculator up for the different screen displays is through SETUP.
Choose your settings by scrolling with the up and down REPLAY keys.
KEY
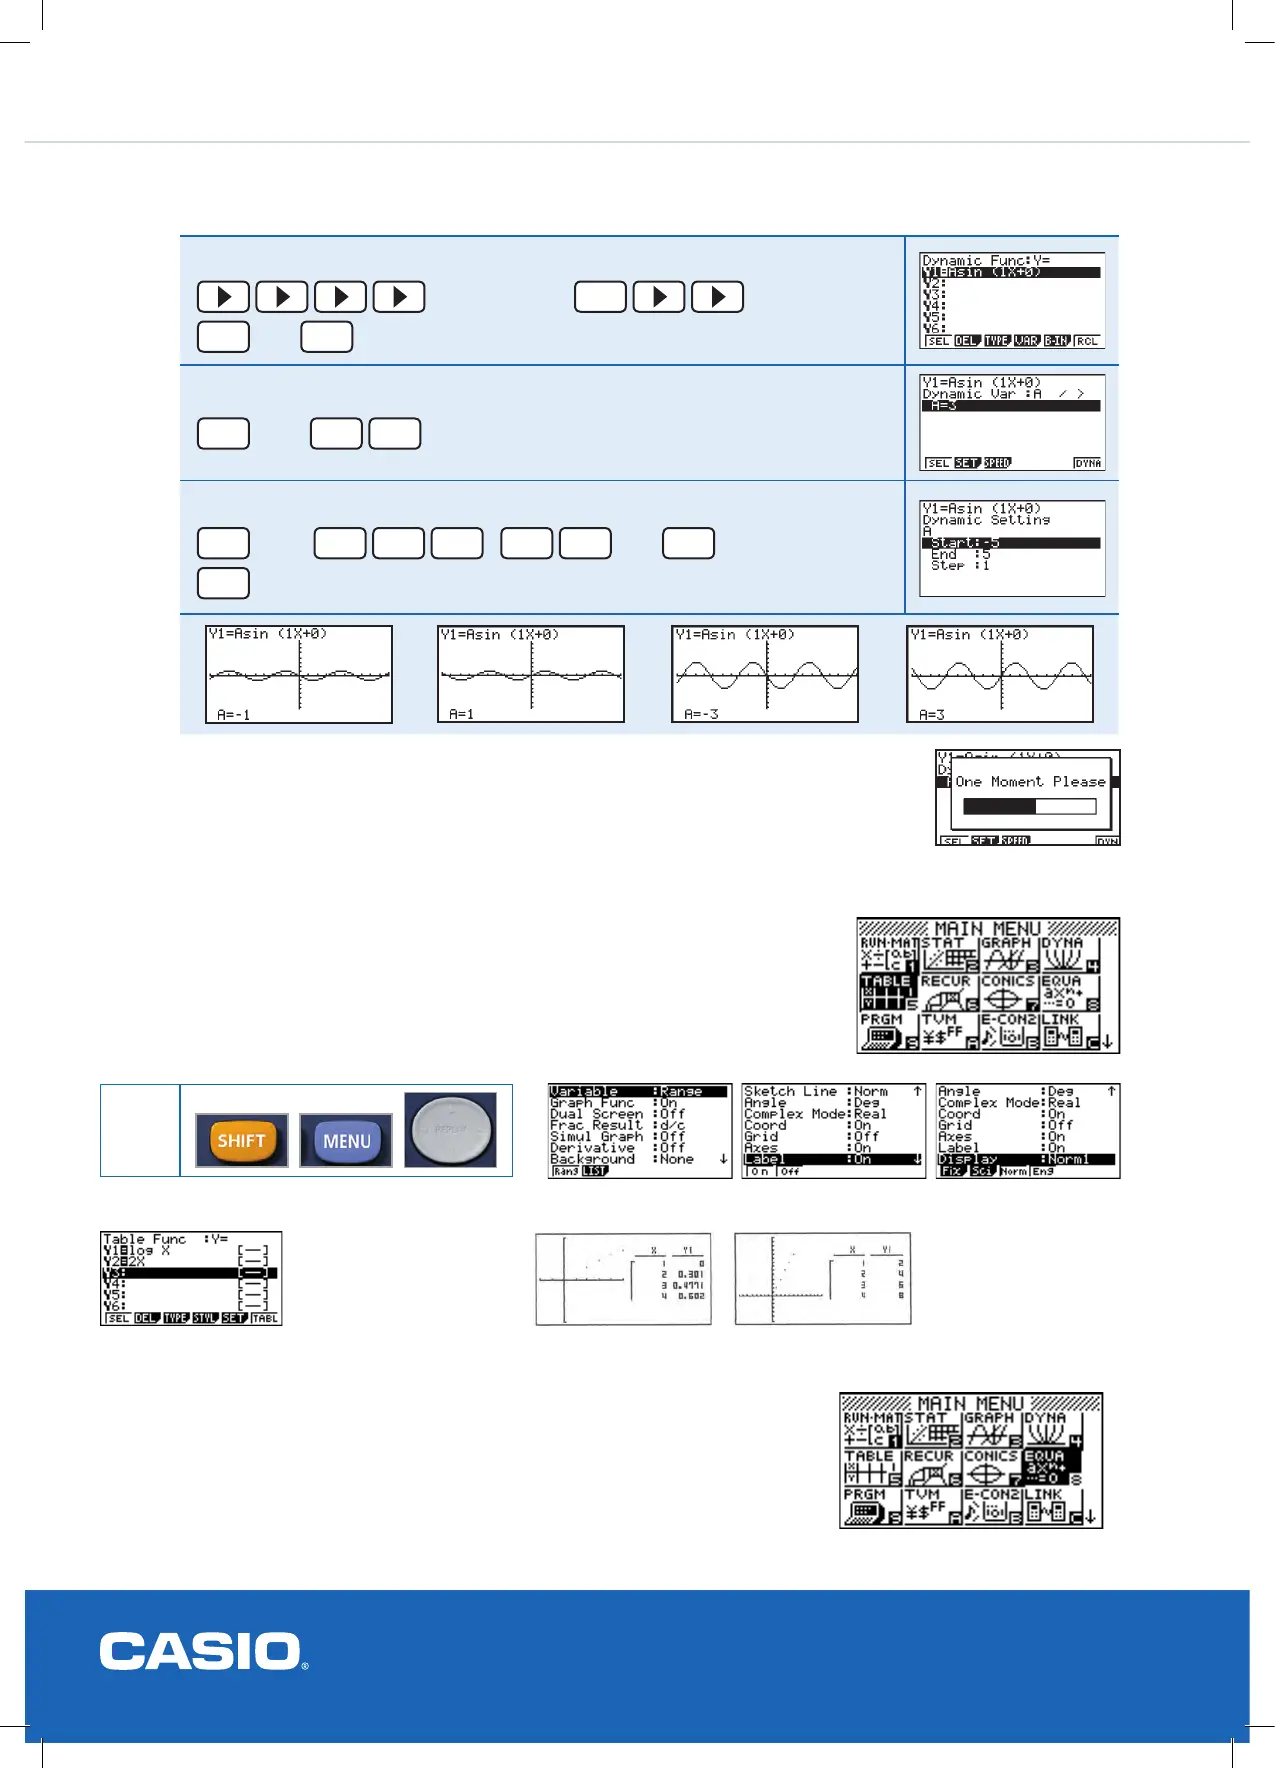
Prior to you seeing the dynamic graph a message will come on the screen (left). This is where the
calculator generates the differing views in relation to the coefcient starting, nishing and pitch
values that has been chosen for the displaying of the ‘family of graphs’.
Store the expression
to override “B”
1
to override “C”
0
then
EXE
Change the variable
F4
[VAR]
3
EXE
Set the dynamic range
F2
[SET]
-
5
EXE
,
5
EXE
then
EXIT
F6
to draw graph