Example
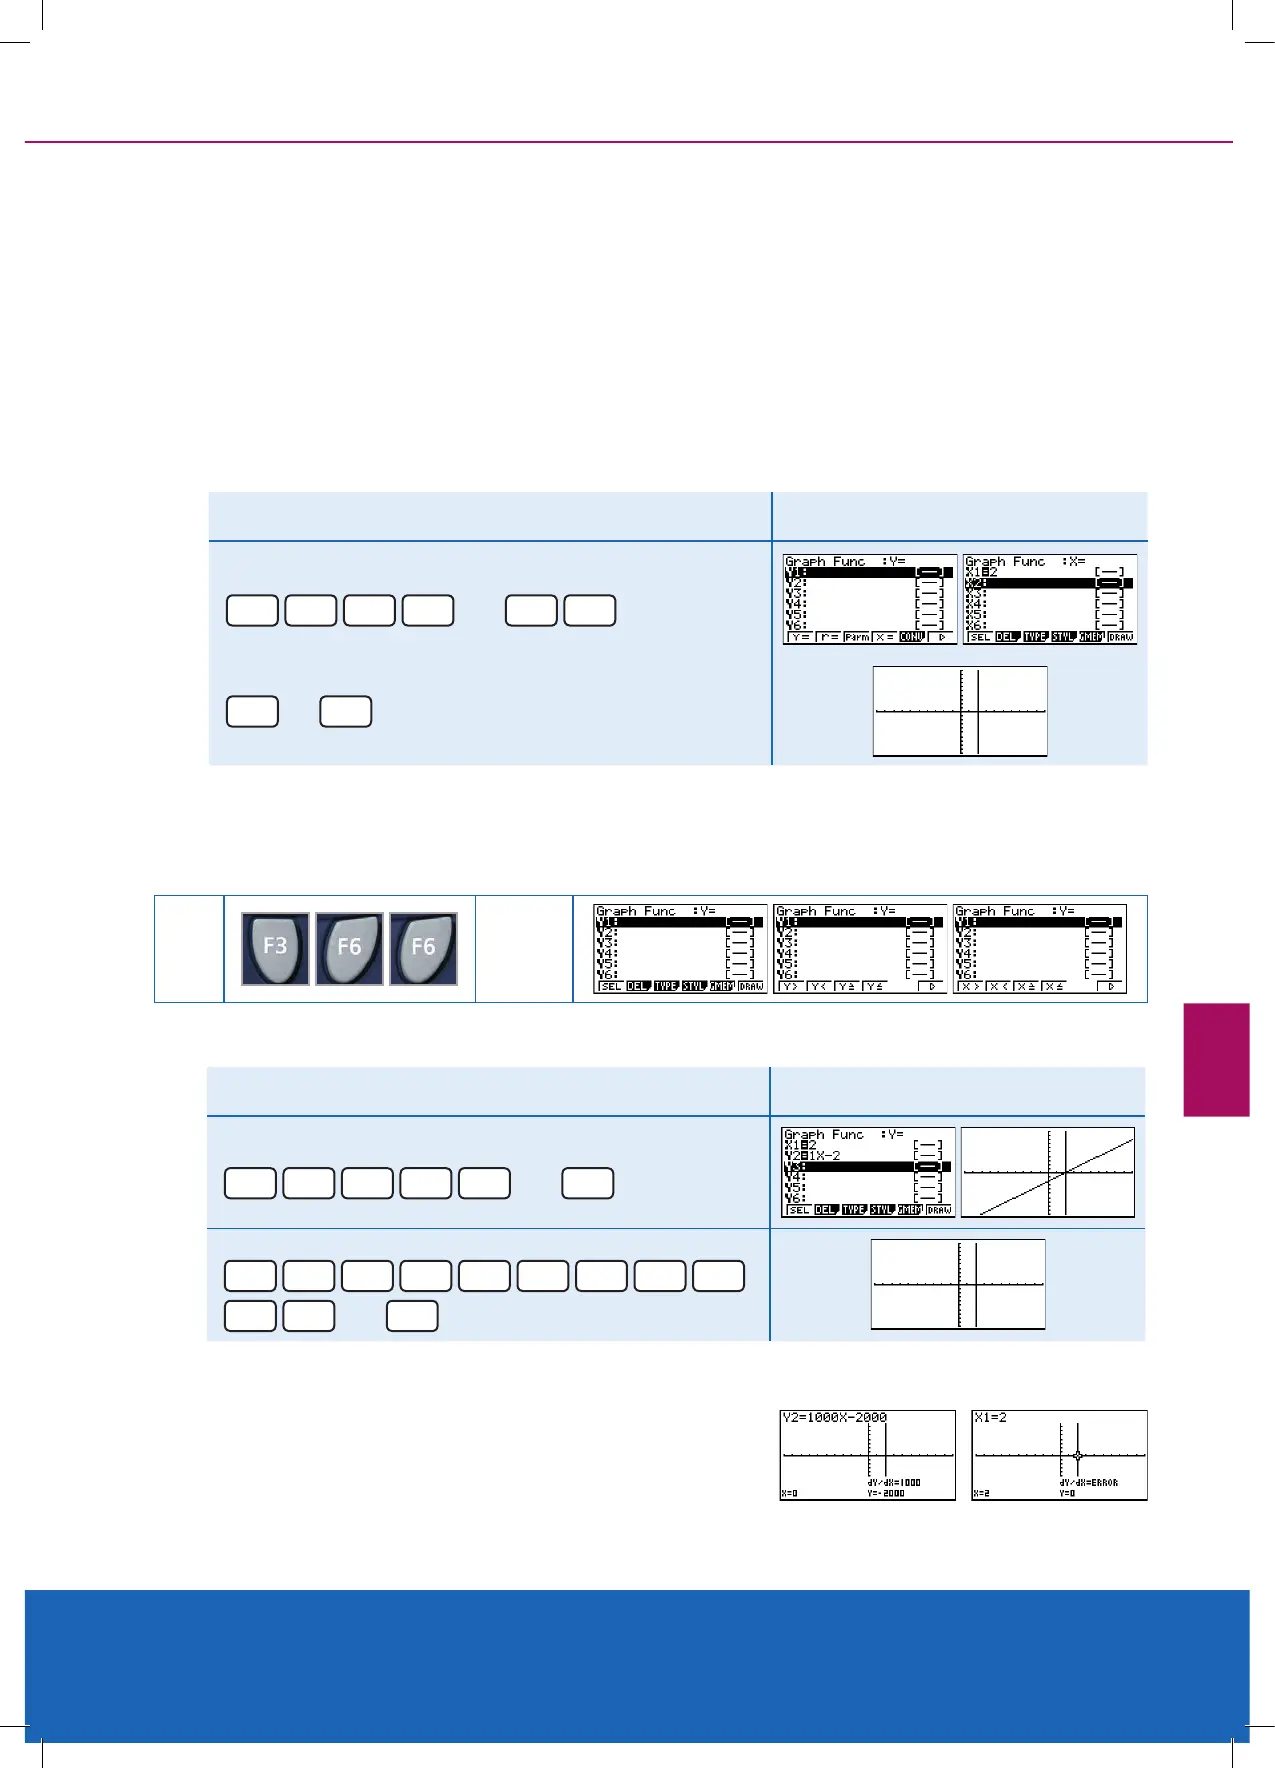
Draw the graph x = 2 Result
Change Y= to X= and the store the equation
F3
F4
EXIT
F1
then
2
EXE
F6
or
EXE
to draw the graph
Linear programming with vertical lines: converting x = c to y = mx + c [in GRAPH]
Note:
When solving linear programming problems coordinates involved with vertical lines cannot be solved using G-Solve.
Converting them to y = mx+c form can assist and give you access to G-Solve.
When drawing any graphs make sure that the V-Window is appropriate to see the graphs that you will be drawing.
[SHIFT] [F3]. Select [F1], in this case for INITial conditions, as a starting point or use the domain and range values
on the grid system that is given in the question to dene the View-Window settings. Now use the [EXIT] or [EXE]
key to go back to the Graph Func: window. Vertical lines x = c, found by menu trail: [F3] for TYPE then [F4] for x =
c format.
In linear programming inequalities are required to nd the ‘feasible region’ that satises the given constraints. You are
able to draw inequalities with x ≥ or < or > or ≤ on the FX9750GII but nding intersection points involving vertical lines
cannot be performed. You need to ‘trick’ the calculator into thinking that it is drawing a vertical line in the y = mx + c
format.
KEY
RESULT
Example 2
Type into the ‘Y2’ space ‘1x – 2’, then try y = 1000x – 2000. Result
Y2=1x-2
1
X,
θ
,T
-
2
EXE
then
F6
Y2=1000x-2000x
1
0
0
0
X,
θ
,T
-
2
0
0
0
EXE
then
F6
The latter produces a ‘vertical line’ very similar to x = 2 over this Viewing window.
But, you have essentially tricked the calculator into drawing a
‘vertical line’. You can check that they are NOT the same by doing
a Trace – [SHIFT] [F1] and using the up / down arrows to trace
either x = 2 and y = 1000x – 2000 (or similar).
cont. on next page
CHAPTER 7 | PG 61

 Loading...


