Normal Distribution Analysis [in RUN-MAT]
Although this could have been covered in the Statistics Chapter this topic needs to be treated separately.
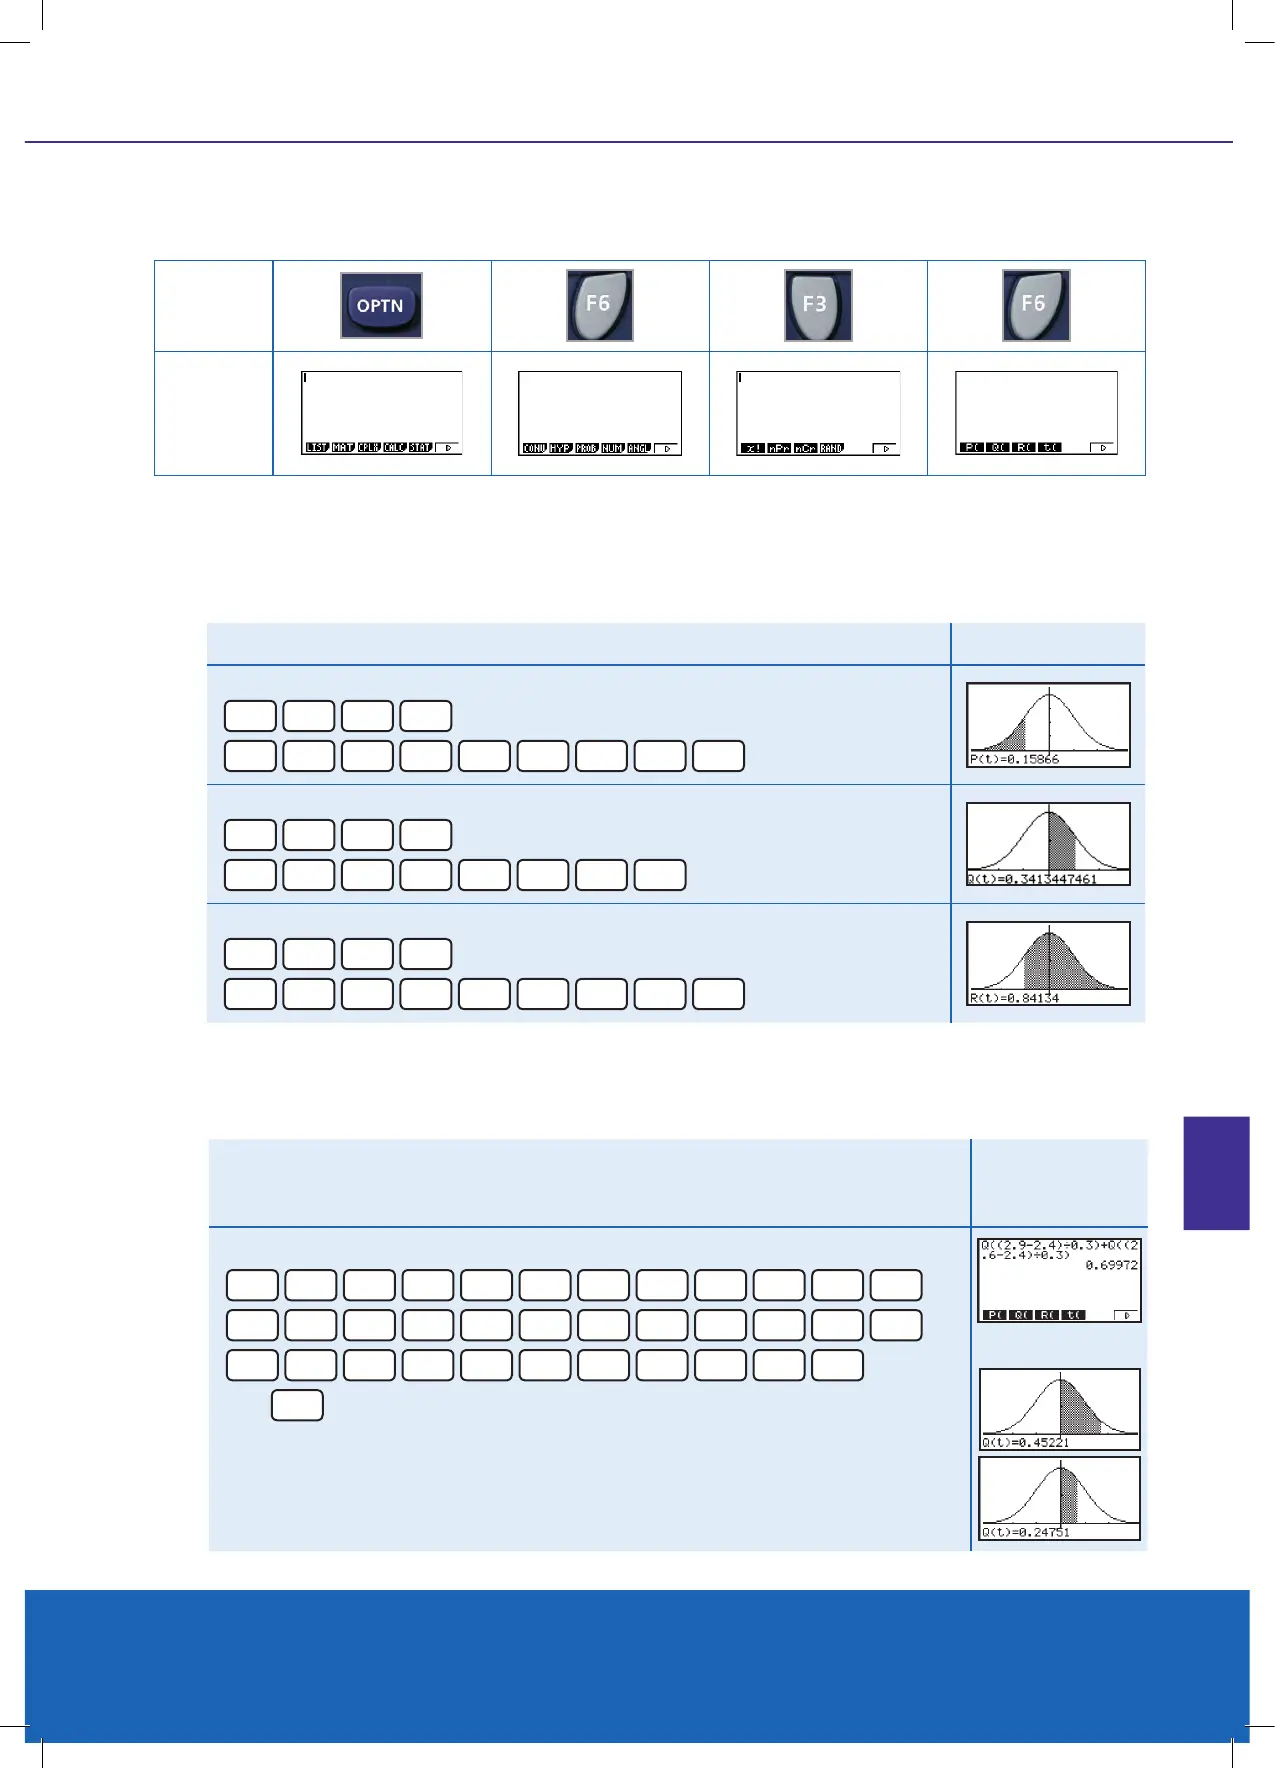
This is the Normal Distribution (N.D.) ‘menu’. P( calculates the N.D. shading from the left, Q( calculates the N.D.
shading from the centre and R( calculates the N.D. shading from the right.
Graph Y = has the sequence: [SHIFT] [F4] [F5] [F1]
Excluding the ‘Graph’ will give the Normal Distribution probability value being displayed only.
Using the z-score transformation within the calculation on the calculator is also a good technique for the student to
use.
KEY
RESULT
Example
Find the probabilities related to a z-score of -1. Result
Graph Y=P(-1)
SHIFT
F4
F5
F1
OPTN
F6
F3
F6
F1
-
1
)
EXE
Graph Y=Q(1)
SHIFT
F4
F5
F1
OPTN
F6
F3
F6
F2
1
)
EXE
Graph Y=R(-1)
SHIFT
F4
F5
F1
OPTN
F6
F3
F6
F3
-
1
)
EXE
Example 2
Scientists studying a species of sh nd that adults have a mean weight of 2.4 kg
and a standard deviation of 0.3 kg.
Find the probability a randomly selected sh weighs between 2.2 kg and 2.9 kg.
Result
OPTN
F6
F3
F6
F2
(
2
.
9
-
2
.
4
)
÷
0
.
3
)
+
F2
(
2
.
6
-
2
.
4
)
÷
0
.
3
)
then
EXE
Note:
2.2 is on the left of the mean and has an equivalent probability value for 2.6, that is,
Prob(2.2 < µ < 2.4) = prob(2.4 < µ < 2.6) giving Prob(2.2 < x < 2.9) = 0.6999 (4dp)
As Graphs
CHAPTER 8 | PG 67