Normal Distribution Analysis [in RUN-MAT] cont.
Data that you have entered in the ‘List’ can also be used to model the data to be normally distributed, that is, assuming
the data is normally distributed. By using the z-score transform and using ‘µ’ and ‘
�
’ generated from the data in the list
will be used to do the appropriate normal distribution calculations.
Enter the data into a list space and then generate the summary statistics associated with the data. Make a note of the
required information and in RUN-MAT mode generate the desired calculations based on the Normal Distribution.
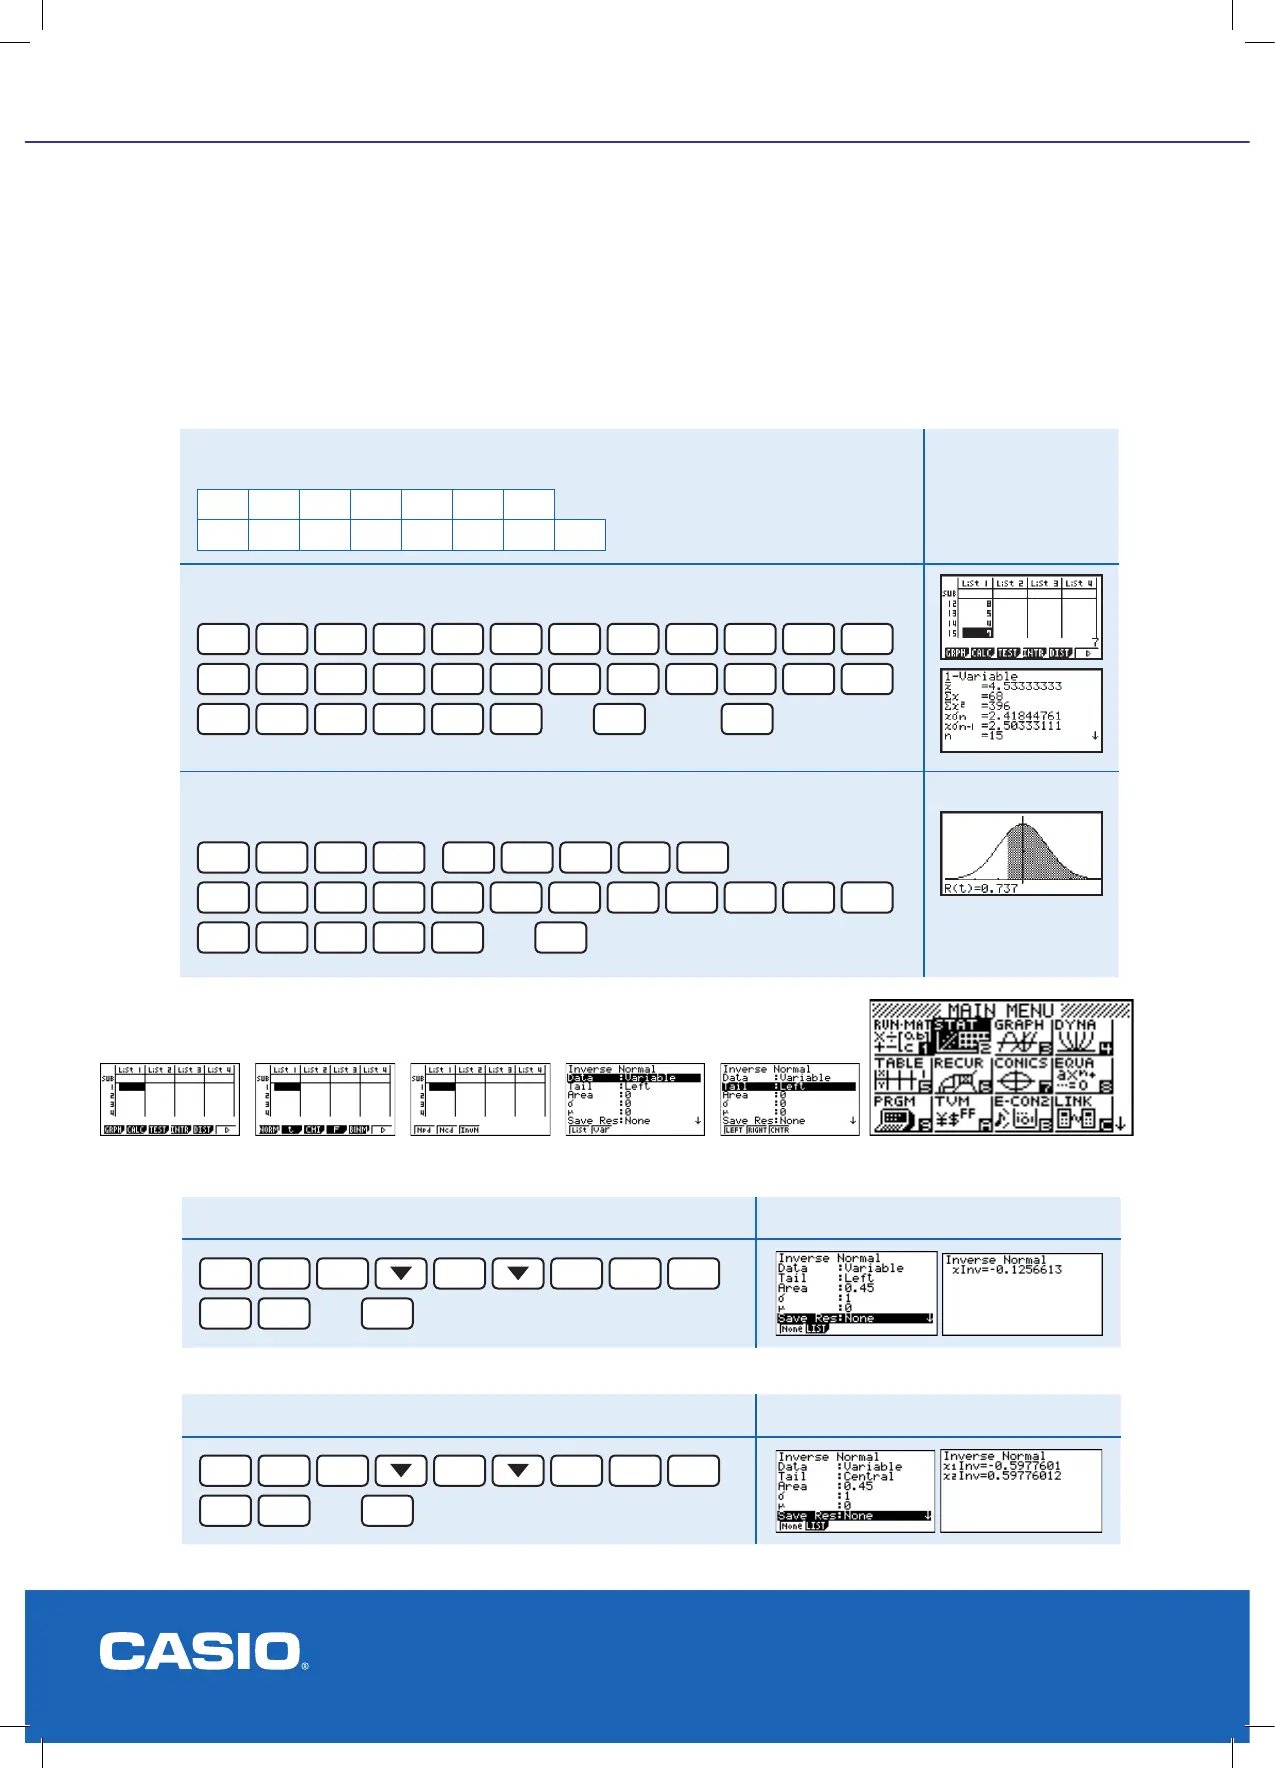
Normal Distribution Analysis [in STAT]
Left, Central and Right selections for Inverse Normal calculations in STAT mode.
Example
Find the values of k such that Prob(Z < k) = 0.45 Result
F5
F1
F3
F1
0
.
4
5
EXE
then
EXE
Example 2
Find the values of k such that Prob(-k < Z < k) = 0.45 Result
F5
F1
F3
F3
0
.
4
5
EXE
then
EXE
Example 3
Enter the following data and assuming N.D. nd the probability that a score of 5
or more is achieved.
1 1 4 5 7 8 4
1 2 4 7 8 5 4 7
Result
Enter the data into list 1
1
EXE
1
EXE
4
EXE
5
EXE
7
EXE
8
EXE
4
EXE
1
EXE
2
EXE
4
EXE
7
EXE
8
EXE
5
EXE
4
EXE
7
EXE
then
F2
[CALC]
F1
[1VAR]
In RUN-MAT mode, complete the desired (1 variation) statistical calculations.
Required Prob(x > 3) = Prob((3 - 4.533)/2.418) using the z-score transformation.
SHIFT
F4
F5
F1
,
OPTN
F6
F3
F6
F3
(
3
-
4
.
5
3
3
3
)
÷
2
.
4
1
8
)
then
EXE
Prob(x > 3) =
0.7370 (4 d.p.)
NORMAL, BINOMIAL AND POISSON DISTRIBUTIONS