PITOT-STATIC SYSTEMS
The airplane is equipped with three separate and independent pitot-static systems. The two primary
systems serve the pilot’s and copilot’s systems. The third provides pitot and static air pressure to the
standby flight display and provides a source of static pressure for the cabin pressure differential
pressure gage.
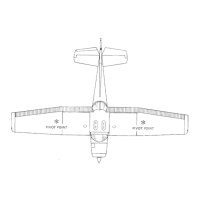
The pitot tube on the left side of the nose of the airplane supplies pressure to the pilot’s AZ-950 micro
air data computer. The pitot tube on the right side of the nose of the airplane serves the same
function in the copilot’s system.
The standby pitot tube is on the right side of the fuselage below the copilot’s aft window and provides
pitot pressure to the standby airspeed indicator/altimeter on the standby flight display (SFD). Three
static ports are located on each side of the airplane, approximately at fuselage station 153. The lower
port on the left side and the upper port on the right side provide the static source for the pilot's
system. The upper port on the left side and the lower port on the right side provide the static source
for the copilot's system. The center ports on each side provide static pressure for the backup pitot-
static system.
The two pitot tubes and four static ports of the primary pitot-static systems, as well as the two static
ports and single pitot tube of the backup system, are electrically heated for ice protection.
AIRSPEED AND ALTIMETER INDICATIONS
Altitude and airspeed data is generated by the AZ-950 micro air data computers, which is transmitted
through the IC-615 Display Guidance Computers to the PFDs. This information is then presented in
color on the PFDs. The micro air data computers also send altitude information to the mode S
(altitude) function of the transponders.
AIRSPEED INDICATION
The indicated airspeed display is to the left of the attitude display on the primary flight display. The
display consists of a “rolling digit” window in the center of an airspeed vertical tape. The resolution of
the rolling digits is one knot. The moving vertical tape moves behind the window and displays digital
airspeed at 20 knot intervals above 200 knots and 10 knots intervals below 200 knots, with the larger
numbers at the top of the scale. The range of the airspeed scale is 30 to 450 knots with tick marks at
10 knot intervals.
An airspeed trend vector, which displays an indication of the direction and rate of airspeed change,
extends vertically from the apex of the current airspeed value display window. It extends upward for
acceleration and downward for deceleration. The trend vector represents a prediction of what the
airspeed will be in ten seconds if the current rate of change is continued.
Cessna Citation XLS - Instrumentation & Avionics