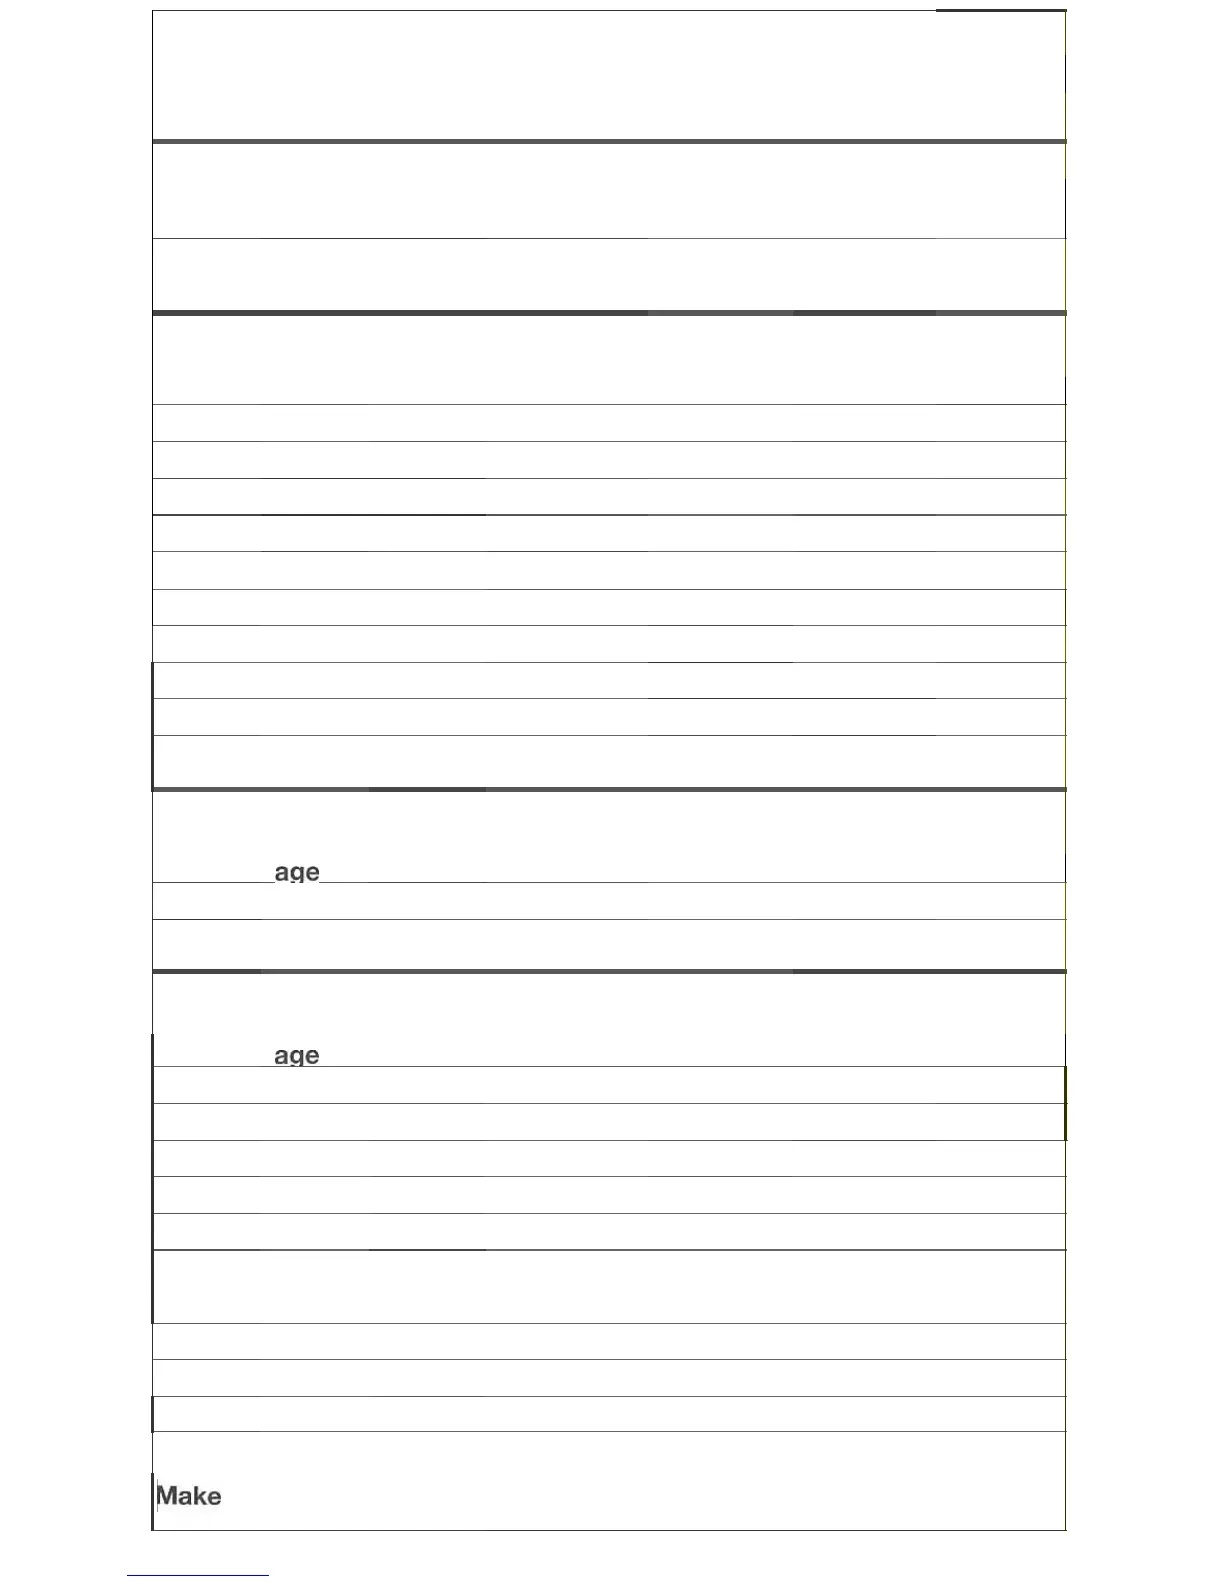
Body Analysis Table
Always keep
in
mind that you know your body best.
The
following ranges
of
body
fa
t,
BMI, body water and bone mass are offered as guides.
too lower
normal higher
too
low than
than
high
normal
normal
BMI <18.4
18
.5-199
20-
25
25.1-29.9
30+
Body Fat
aoe % % % %
%
Male
20-29
<13%
13.1-18% 18.1-23% 23.1-28%
28.1%+
30-39
<14
14.1
-19 19.1-24
24.1-29
29. 1+
40-49
<1
5
15.1-20 20.1-25 25.1-30 30. 1+
50-59
<16
16.1-21
21.1-26 26.1-31
31
.1+
60-69 <17
17
.1
-22 22.1-27
27.
1-32 32.1+
Female 20-29
<18
18.1-23
23.1-28 28.1-33 33.1+
30-39
<19
19.1-24
24.1-29 29.1-34
34.1+
40-49
<20
20.1-25
25.1
-30 30.1-35
35.1+
50-59
<21
21.1
-26 281
-3
1
31. 1-36
36.1
+
60-69 <22
22.1-27
27.1
-32 32 1-37
37.1
+
Body
Water
aRe % % %
%
%
Male
20-69
<46.4%
46.5-49.9% 50-65% 65.1-70% 70.1%+
Female
20-69
<43.9
44-44.9 45-60 60.1-67.6 67.
7+
Bone Mass
aRe %
%
% % %
Male
20-29
<7
.2%
7.3-7.
5%
7.6-8.4% 8.5-8.7%
8.8%+
30-39 <7.0 7.1-7.3
7.4-8.2 8.3-8.5
8.6+
40-49 <6.6
67-69
7-7.8 7.9-8.1
8.2+
50-59 <6.2
63-65
6.6-7.4 7.5-7.7
7.8+
60-69 <5.9
60-62
6.3-7.1
7.2-7.4
7.5+
Female
20-29 <5.8% 5.9-6
.1
% 6.2-7% 7.1-7.3% 7.4
%+
30-39 <5.6
5.7-59
6-68
6.9-7.1 7.2+
40-49 <5.2
5.3-55 56-6.4
6.5-6.7
6.8+
50-59
<4
.8
4.9-5.1
52-6
6.1-6.3
6.4+
60-69
<4.5
4.6-4.8
4.9-5.7 5.8-6.0
6.1+
~ake
the most of
it!