Graph Analysis
26
Graph Analysis
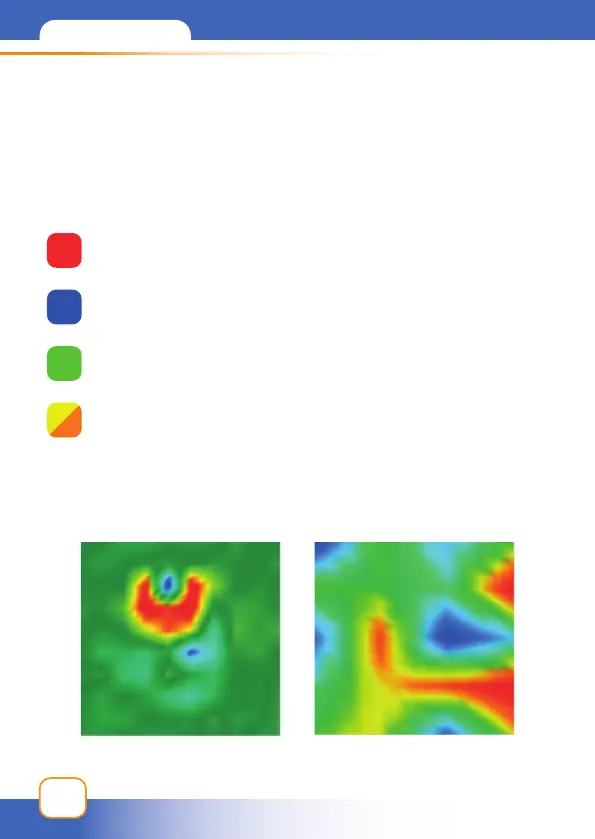
When you observe the data you have obtained graphically
variability in the scan result.
The meanings of the colors in
the graph obtained as a result of scanning are as follow:
and shapes in the graph;
Orange and Yellow:
Red:
Blue:
Green:
Metal
Mineral