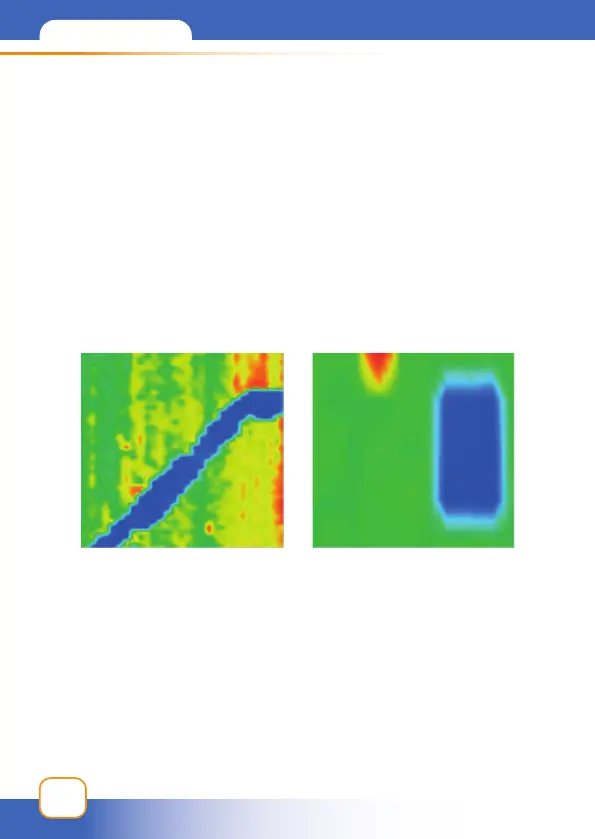
EasyManua.ls Logo

Conrad GR-3 - Analyzing Cavity Data in Scan Graphs

Conrad GR-3
32 pages
Print Icon
To Next Page IconTo Next Page
To Previous Page IconTo Previous Page
Loading...
Graph Analysis
28

      

in the graphic.


turquoise and light green.
          


rectangular and tomb-size shape.
There must be at least 15 drops between the soil shown in
green and the cavity shown in blue in the graph.

have a value between 135-130
.

        

Tunnel


Related product manuals