- 14 -
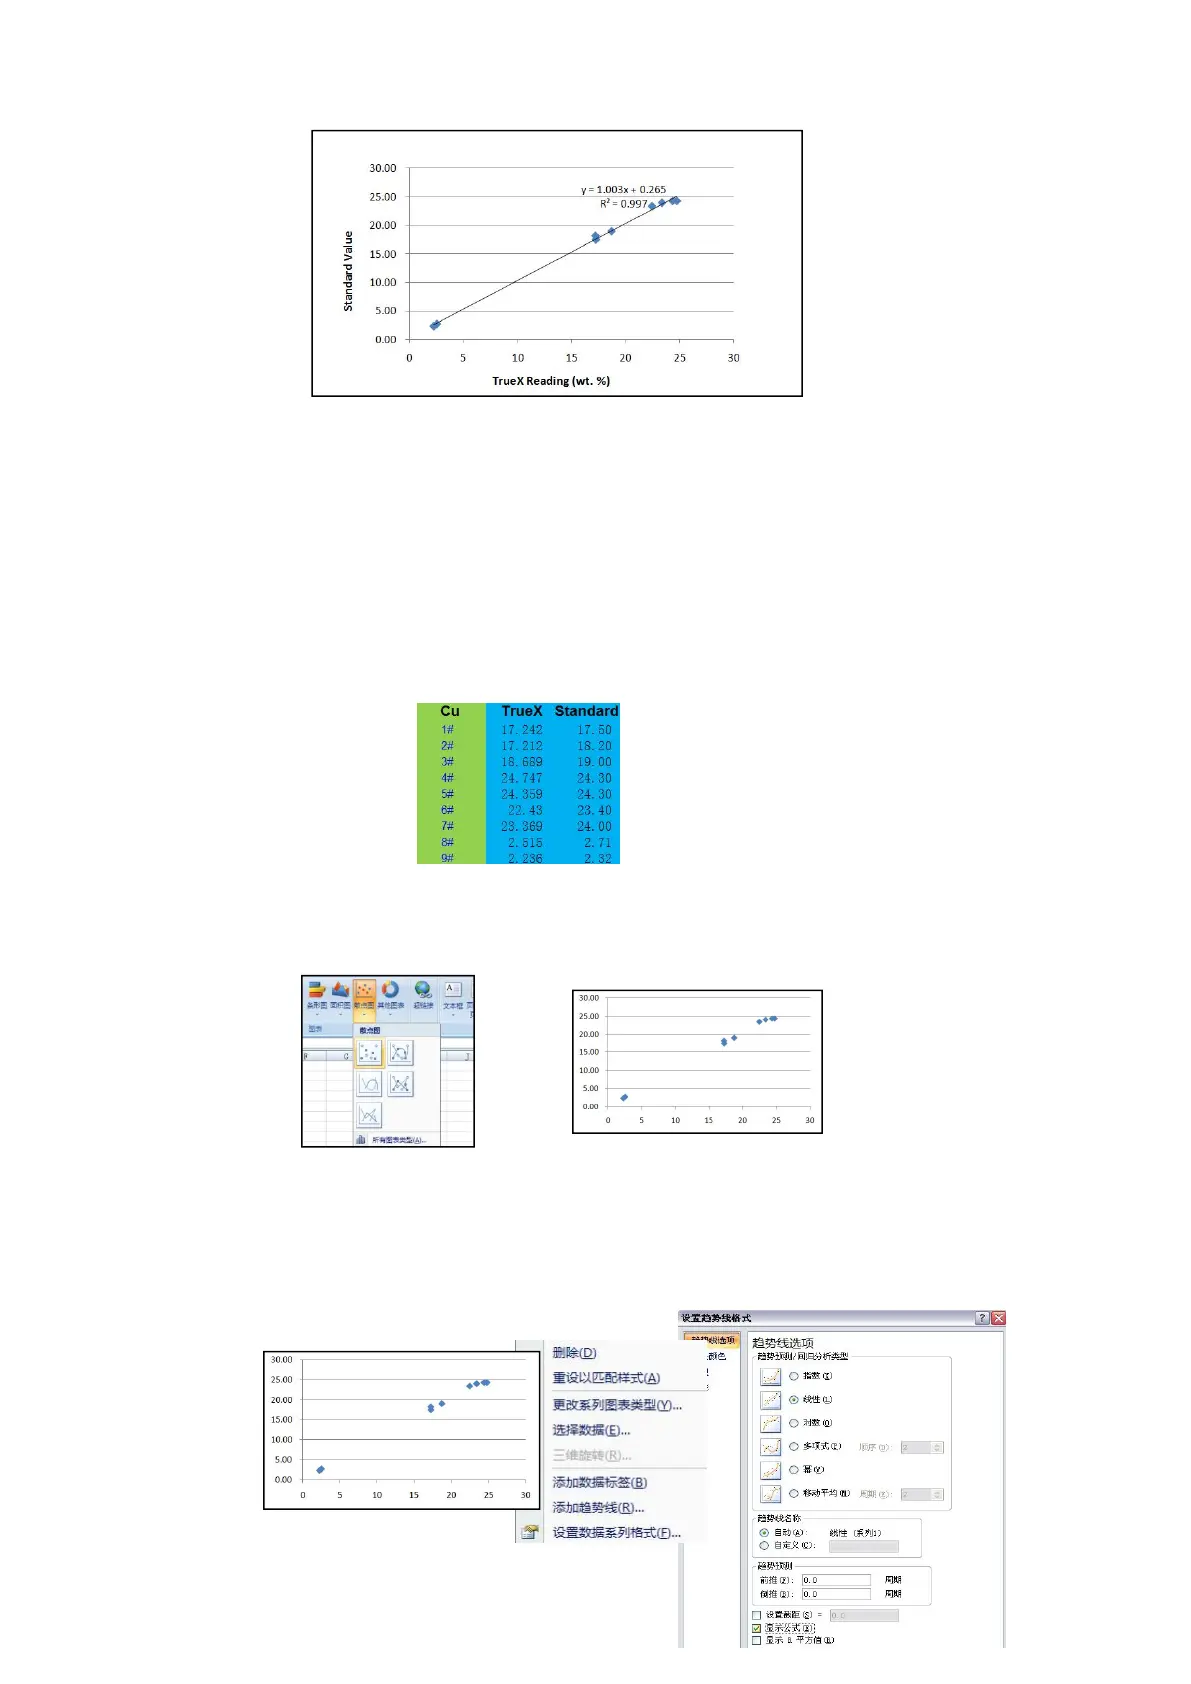
Fig 1. The correction factor linear regression diagram
The slope and intercept should be calculated by linear regression. Y=mx+b,
Formula m is the slope, b is the intercept. Then m and b directly enter a new model.
The correction factor can be use EXCEL to calculate the linear regression。y value
represents laboratory data, x value represents TrueX results.
Examples
a) The measured value and the true value correspondence, Recorded in the EXCEL table,
Note that the measurement first, the real value after, As shown fig3.
Fig 3
b) Use the mouse to select all data, Under the Insert menu, select Scatter Plot, Figure 4,
Select the first to give Fig 5.
Fig 5
c) Select the data on the coordinates,Right-click, Choose: Add Trendline, The screen
will display the dialog box, After "Display formula" check, Press Close to obtain the
Fig 7。
 Loading...