28
EXPERT UI: NETWORK TAB: CONTROLLER INFO
The Controller Info screen shows some internal technical data of the controller hardware used.
This includes the detailed information about the Role of the controller in the network, the Z-Wave transceiver
hardware used, firmware running on the Z-Wave transceiver and the release information of the Z-Way software. This
information may be needed during support and debugging.
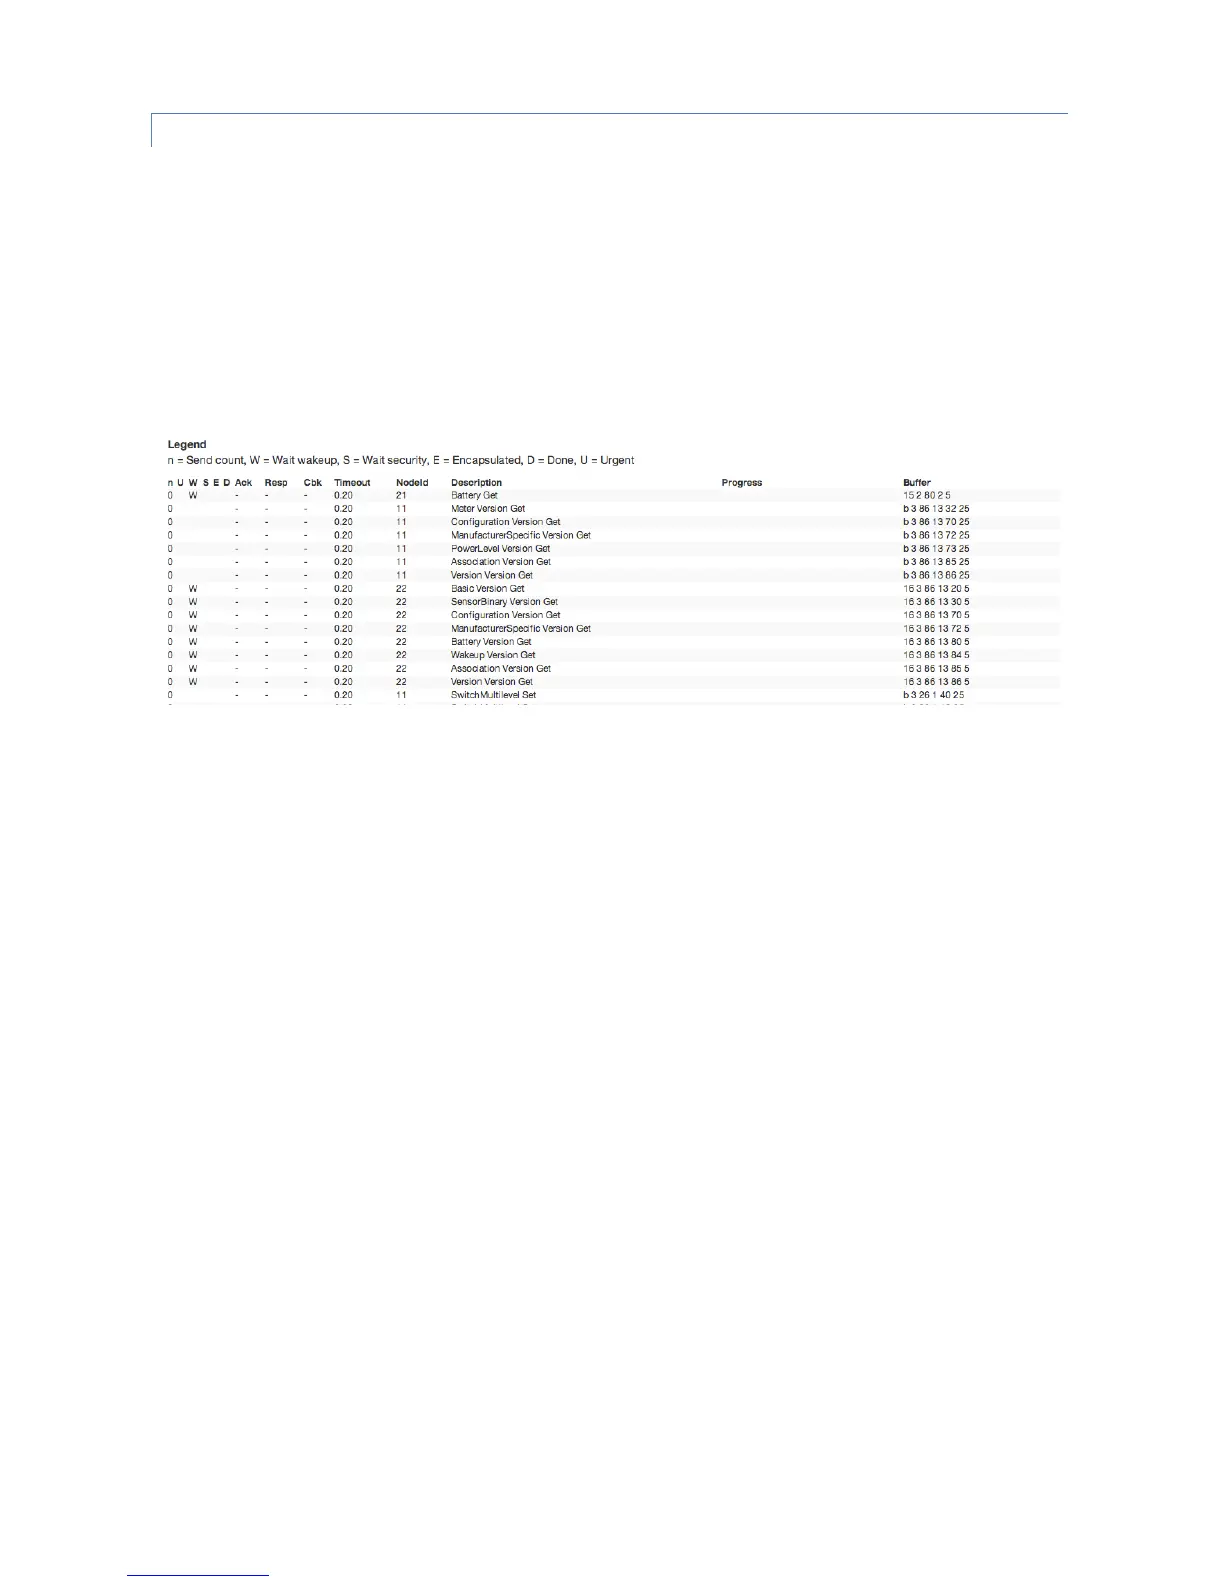
“View Job Queue” button shows the screen which offers some deep insight into the dynamics of the controller
software. It visualizes the job queue of the system. Every communication attempt of the controller is queues into a job
queue and then handed over to the Z-Wave chip for execution. The list shows the jobs pending and the jobs that are
completed or failed.
A legend informs about the meaning of the different flags n, U, D, E, S and W. The timeout value counts back from 20
seconds once the job was sent. Even when it was completed the job will stays in the queue marked as done (D) for
some more time to allow inspection. The target node ID, a description of the communication message, a information
about the process and the real Bytes of the message are shown as well.