EN
41
WEATHER FORECAST, AIR PRESSURE TENDENCY INDICATOR ICONS
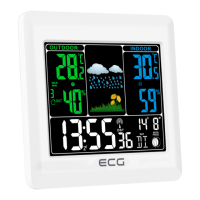
The device integrates the air pressure sensor monitoring continual pressure changes. The weather forecast
station needs approx. 24 hours for collecting suciency of data for forecast calculation for next 12-24 hours.
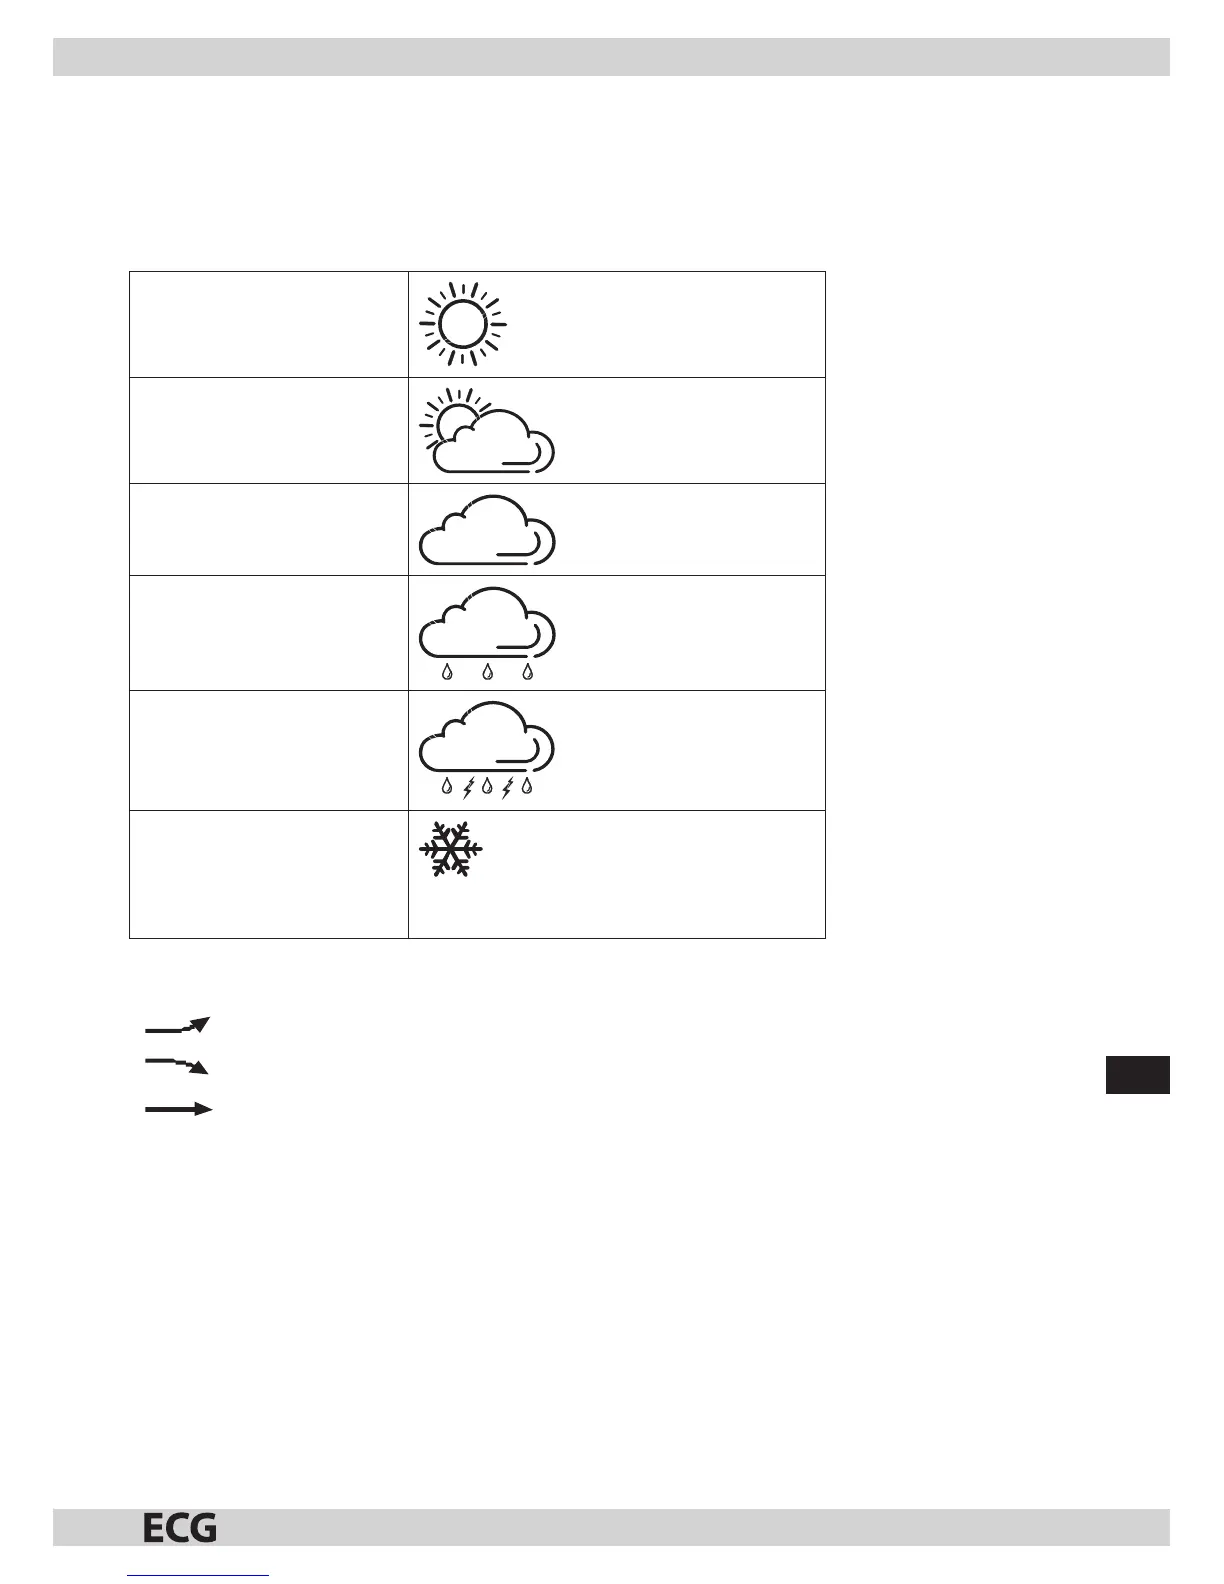
WEATHER FORECAST ICON
It shows ve dierent weather icons.
CLEAR WEATHER
PARTLY CLOUDY
PARTLY CLEAR WEATHER
OVERCAST
RAINY
STORMS
FROST WARNING
Frost icon appears at outdoor temperature
decrease bellow +3°C.
AIR PRESSURE TENDENCY INDICATOR
If arrow appears, air pressure increases and weather improvement may be awaited.
If arrow appears, air pressure decreases and weather deterioration may be awaited.
If appears, air pressure is stable.
AIR PRESSURE HISTORY CHART
1. The chart shows air pressure changes history during recent 12 hours in 6 steps: 0h, -1h, -2h, -3h, -6h, and
-12h.
2. Value in “0h” indicator represents the pressure record within last hour.
3. Columns represent press in hPa at appointed time.
4. If columns increase it means that, based on increasing pressure, weather should improve.
5. If columns decrease it means that weather deterioration is awaited since actual time “0h”.
Remarks: Relocation of the station from one oor to other naturally aects exactness of air pressure
measurement, therefore let the device in the same altitude. After relocation, data stabilization
takes another 12-24 hours.
The station provides weather forecast for next 12-24 hours. Data need not comport with current weather
conditions.



 To Next Page