18
REFERENCE – THD Analysis & Threshold
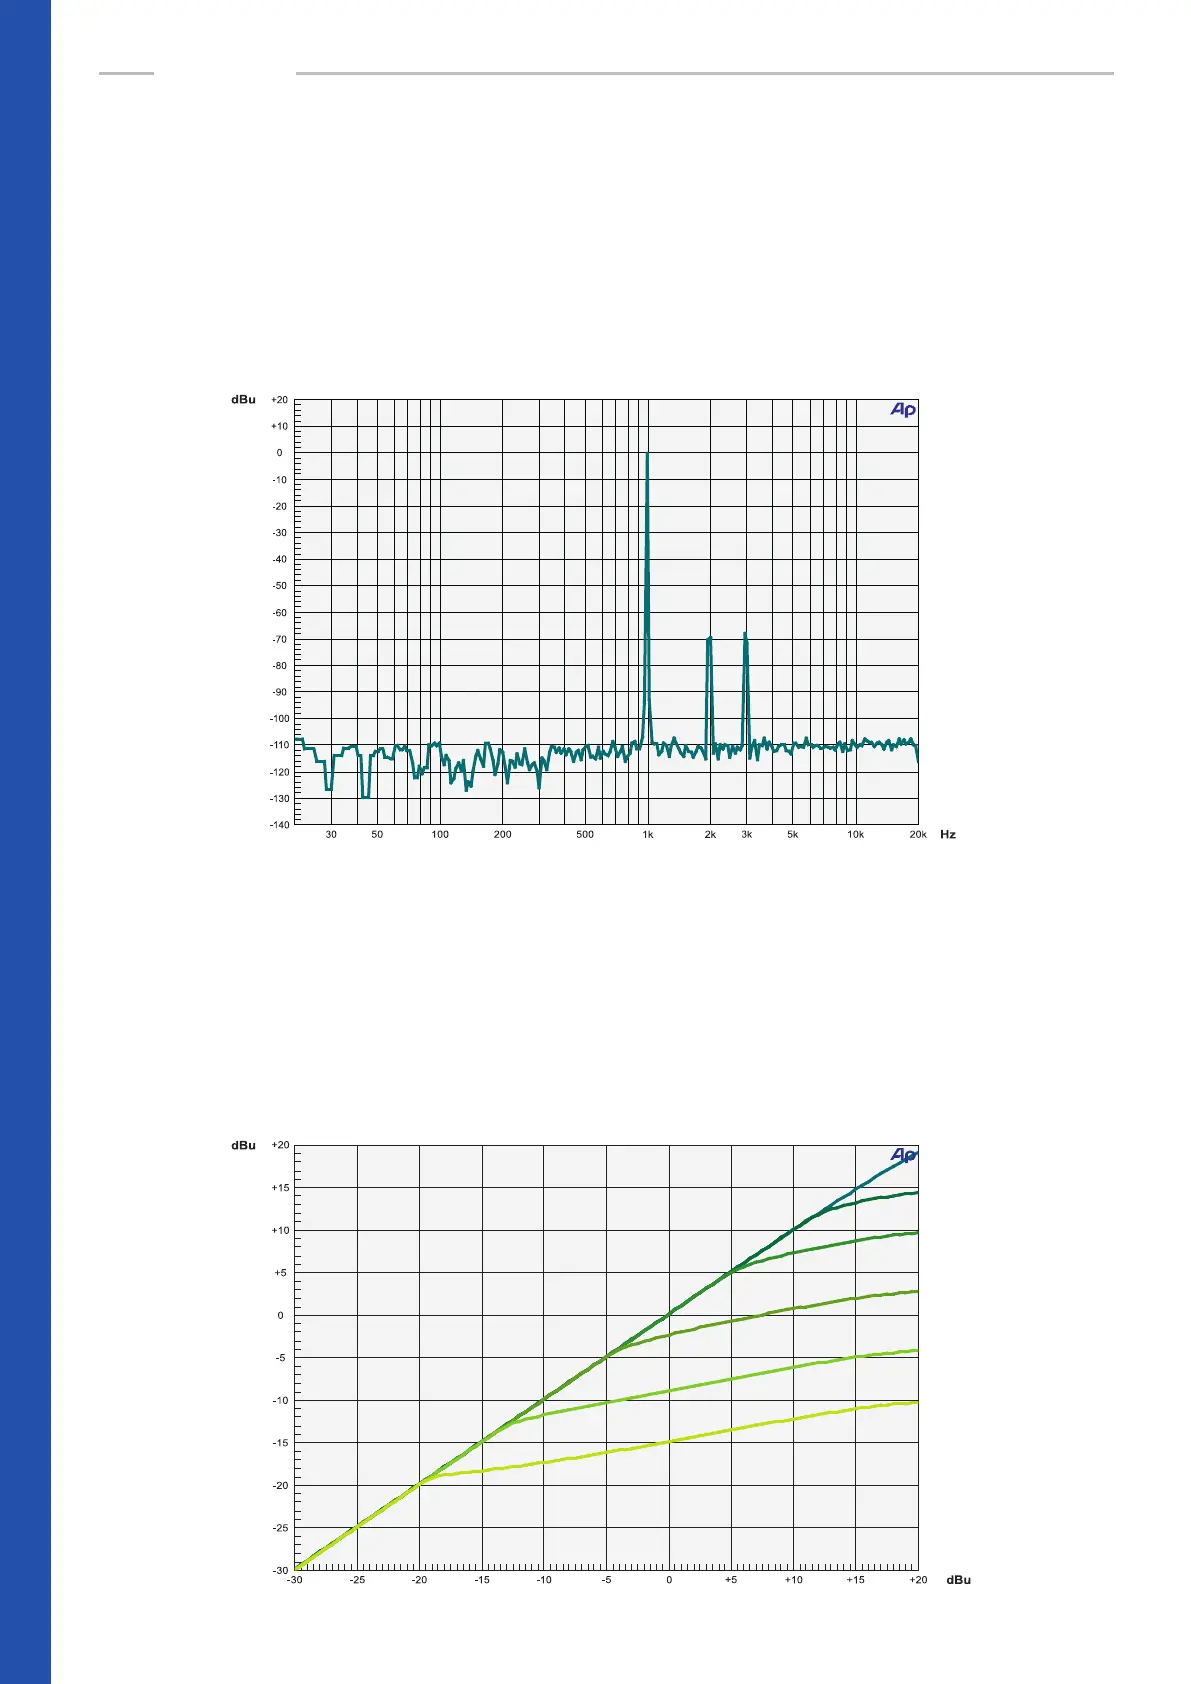
THD Analysis
This diagram shows the FFT spectrum with a sine wave of 1 kHz at 0 dBu. The additionally gener-
ated second and third harmonics at 2 kHz and 3 kHz which make the processed signals sound
richer and more interesting become very obvious here. These harmonics are generated in the
transconductance amplier stages of the mpressor. Their amount is dependent on the input level:
the higher it is, the more harmonics are produced. As the gain controller is placed directly in the
input stage, it will also inuence the intensity of added harmonics.
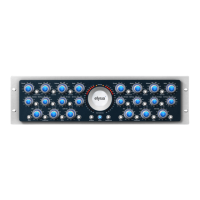
Threshold
The next gure shows a number of dierent threshold points. The settings of threshold and ratio
should always be considered as a couple: If a high ratio is applied, the threshold will usually be in
the lower range in order not to produce a too high amount of gain reduction. If lower ratio settings
are chosen, though, the threshold will be turned more clockwise as a general rule. The complete
control range covers a total of 34 dB, oering the complete variety from very sensitive processing
up to the most extreme eect settings.
REFERENCE