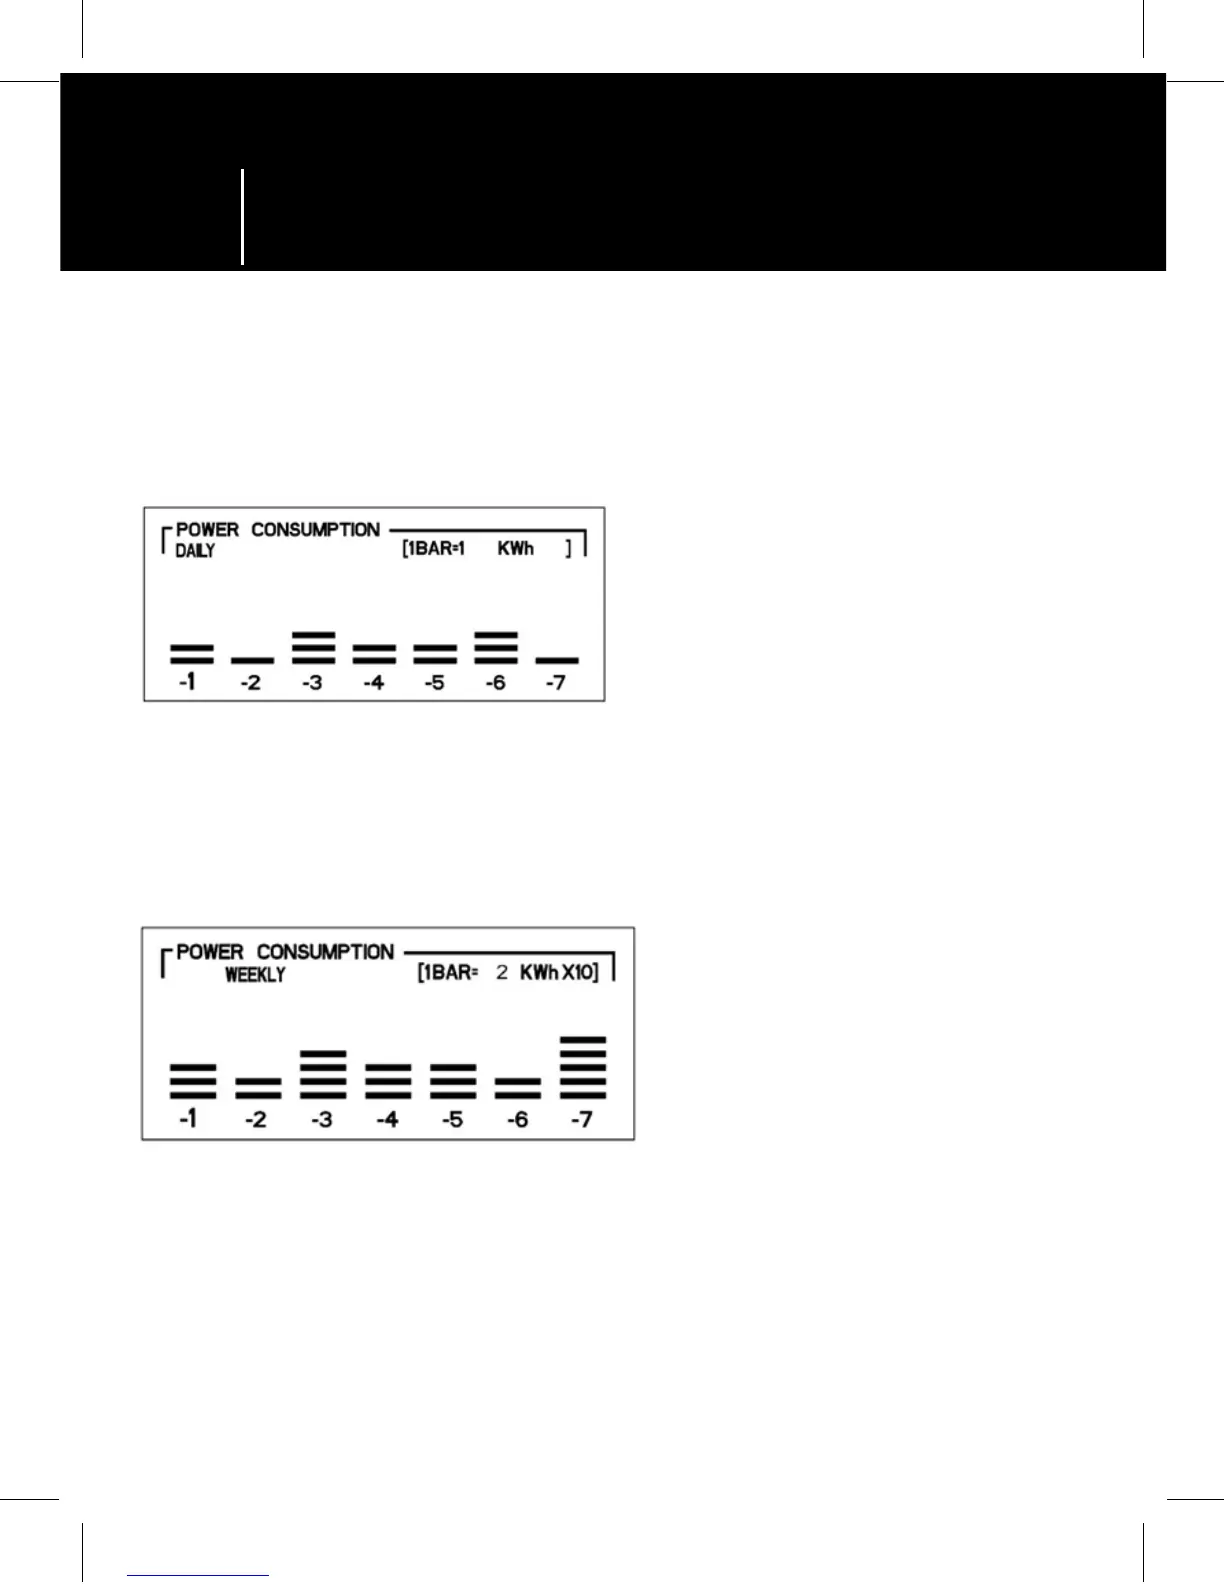
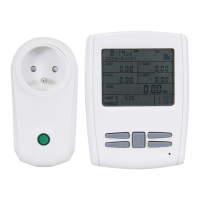
7 days
the top right corner of the graph shows the conversion ratio, indicating the power
consumed. In this case, each bar corresponds to 1 kWh, i.e. yesterday, power
consumption was 2 kWh (1 kWh × 2 bars)
7 weeks
the top right corner of the graph shows the conversion ratio, indicating the power
consumed. In this case, each bar corresponds to 20 kWh (2 kWh × 10), i.e. last week,
power consumption was 60 kWh (20 kWh × 3 bars)
7 months
the top right corner of the graph shows the conversion ratio, indicating the power
consumed. In this case, each bar corresponds to 50 kWh (5 kWh × 10), i.e. last month,
power consumption was 100 kWh (50 kWh × 2 bars)
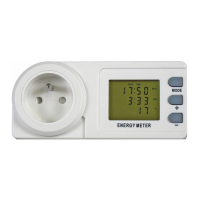
Power consumption metre
GB