5
Press the „HISTORY“ button and select which value you want to change. By pressing „ENERGY/+“
or „COST/-“, you can increase or decrease the values. When you are done, press „SET/OK“.
2.2 Setting power current tari 2
To set up power current tari 2, proceed as described in points 2 and 2.1
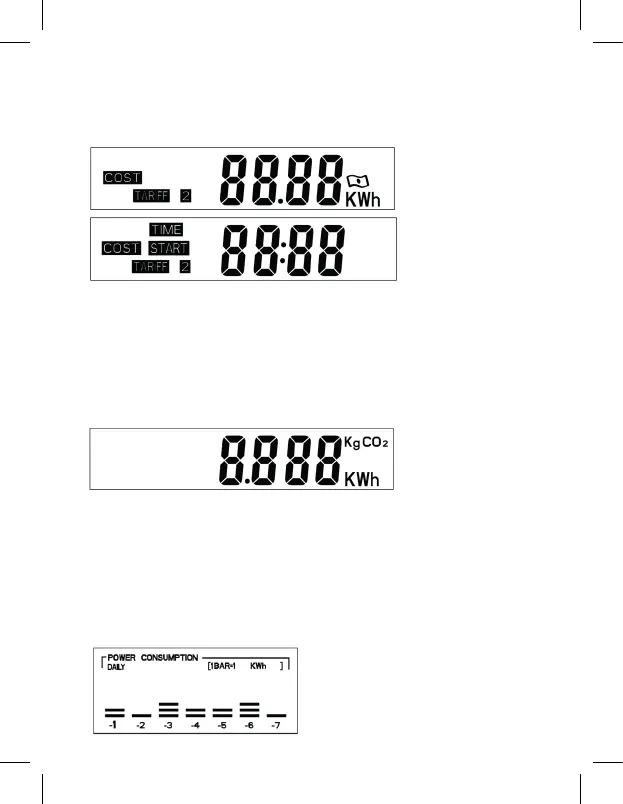
Note: If dual tari is set, tari 1 will start from the set time and turn o when the set time
for tari 2 comes. Current tari 2 will end the moment tari 1 begins.
3. Overload settings
Hold the „ENERGY/+“ button for 3 seconds; the top left corner of the screen will now
display „OVERLOAD“. Then, using the „HISTORY“ button, move between values and set the
maximum load. The default setting is 3 680 W. You can save the settings by pressing „SET/
OK“. After exceeding the set value, the „OVERLOAD“ sign will start blinking.
4. Setting CO
2
:
Keep pressing „COST/-“ until you reach the following screen.
Then hold the „SET/OK“ button for 3 seconds. Using the „HISTORY“ button, move between
values. „ENERGY/+“ and „COST/-“ increase/decrease the values. You can save the settings
by pressing „SET/OK“.
5. Consumption graph for the last 7 days/weeks/months
Using the „HISTORY“ button, you can change display settings to the last 7 days, 7 weeks
or7months.
7 days
the top right corner of the graph shows the conversion ratio, indicating the power con-
sumed. In this case, each bar corresponds to 1 kWh, i.e. yesterday, power consumption
was 2 kWh (1 kWh × 2 bars)