6
7 weeks
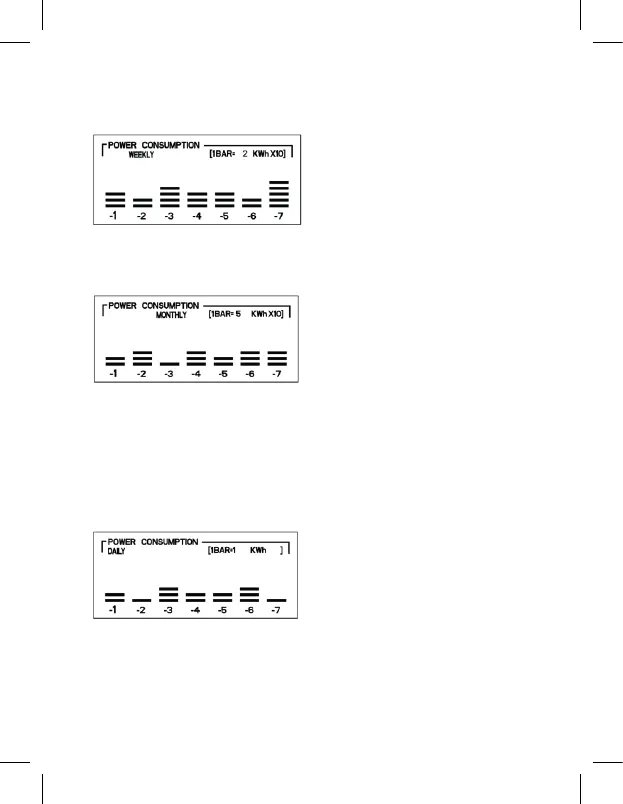
the top right corner of the graph shows the conversion ratio, indicating the power con-
sumed. In this case, each bar corresponds to 20 kWh (2 kWh × 10), i.e. last week, power
consumption was 60 kWh (20 kWh × 3 bars)
7 months
the top right corner of the graph shows the conversion ratio, indicating the power con-
sumed. In this case, each bar corresponds to 50 kWh (5 kWh × 10), i.e. last month, power
consumption was 100 kWh (50 kWh × 2 bars)
The individual power consumption values shown using bars are:
1BAR = 1 kWh
1BAR = 2 kWh
1BAR = 3 kWh
1BAR = 5 kWh
1BAR = 1 kWh × 10 (10 kWh)
1BAR = 15 kWh
1BAR = 2 kWh × 10 (20 kWh)
1BAR = 3 kWh × 10 (30 kWh)
1BAR = 5 kWh × 10 (50 kWh)
6. Actual consumption in days/weeks/ months
6.1 Actual power consumption in the last 7 days:
Hold the „HISTORY“ button for 3 seconds once the screen shows the „daily“ value.
Press „ENERGY/+“ or „COST/-“ to select the day you want to show. Display -1 means
yesterday, -2 two days ago etc. up to -7 aweek back. The real power consumption is
shown on the second line.
6.2 Actual power consumption in the last 7 weeks:
Hold the „HISTORY“ button for 3 seconds once the screen shows the „weekly“ value.