30
30
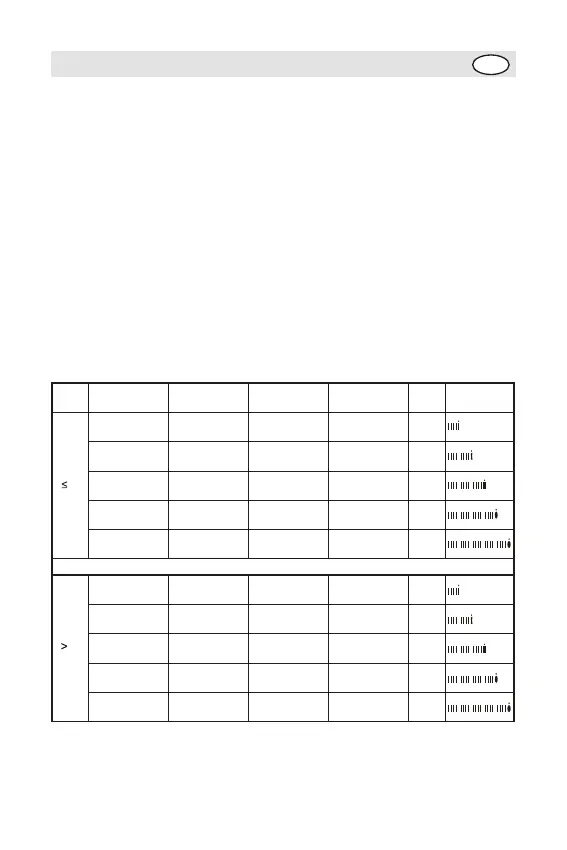
4.0-16.0%
16.1-20.5%
20.6-25.0%
25.1-30.5%
30.6-60.0%
66.0-57.8%
57.7-54.7%
54.6-51.6%
51.5-47.8%
47.7-27.5%
4.0-11.0%
11.1-15.5%
15.6-20.0%
20.1-24.5%
24.6-60.0%
66.0-61.2%
61.1-58.1%
58.0-55.0%
54.9-51.9%
51.8-27.5%
4.0-20.0%
20.1-25.0%
25.1-30.0%
30.1-35.0%
35.1-60.0%
66.0-55.0%
54.9-51.6%
51.5-48.1%
48.0-44.7%
44.6-27.5%
4.0-15.0%
15.1-19.5%
19.6-24.0%
24.1-28.5%
28.6-60.0%
66.0-58.4%
58.3-55.3%
55.2-52.3%
52.2-49.2%
49.1-27.5%
Age
Fat(F) Hydration(F) Fat(M) Hydration(M)
Status
Key Line
Indication
Thin
Slim
Normal
Heavy
Over
weight
Thin
Slim
Normal
Heavy
Over
weight
SUN
GB
29
About Fat
1. About Fat%
• Fat% is an index % of fat content in human body.
• The fat content in human body is of a certain level, overabundance of fat will bring
bad effects on metabolism, thereby, various illnesses may invade.
Here goes an old saying, “Obesity is hotbed of illness”.
2. Working Principles
As electrical signal of certain frequency transmits through human body, the impedance
of fat is stronger than that of muscle or other human tissues. Through the use of
biological resistance analysis, this product will pass a safe frequency of low voltage
electrical current through human body, thus, the Fat% will be reflected according to the
resistance differences when the electrical signal transmitting through human body.
3. Fat/Hydration Content Fitness Assessment Chart
After your weighing, you can use the following Assessment Chart for reference:
• The above information is only for reference