22
AP SERIES
970-292 Revised 5-12
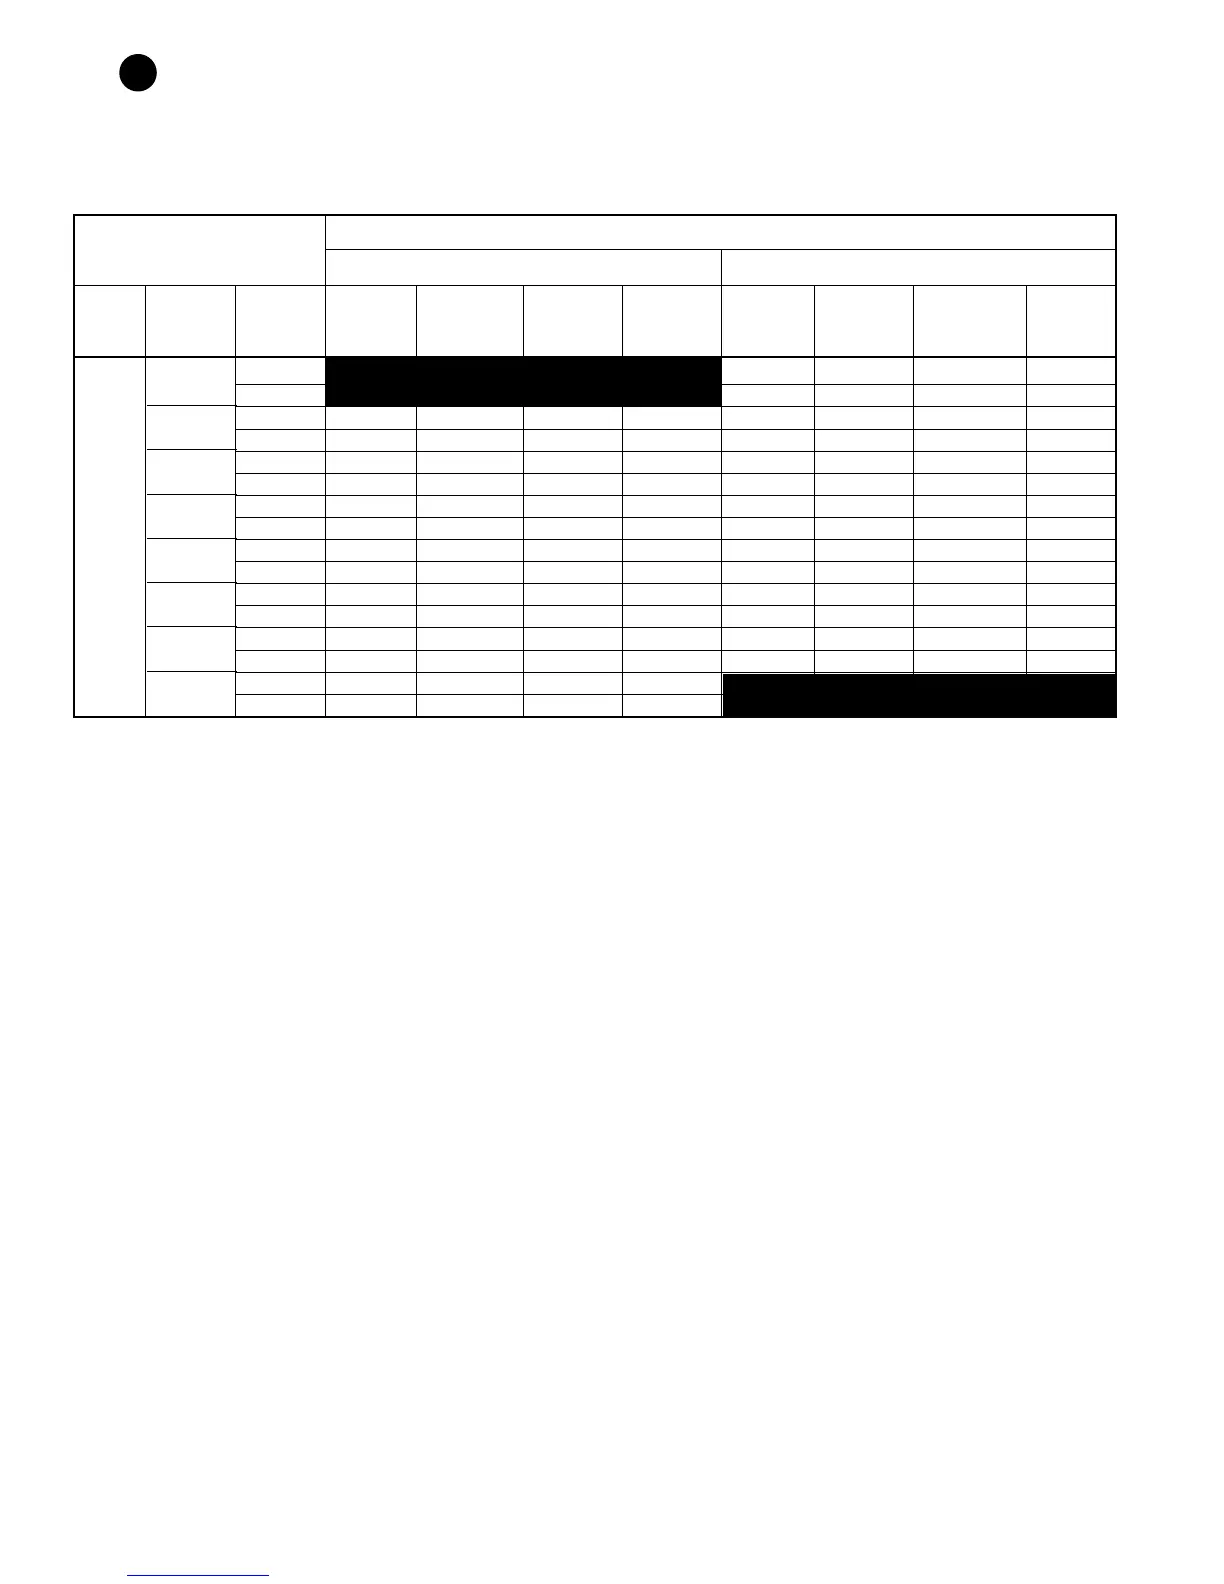
Operating Pressures & Temperatures
Environmentally Safe R-410A Refrigerant
This chart shows approximate temperatures and pressures for a unit in good repair. The values shown are meant as a guide only and should not be used to estimate system
charge. This chart assumes rated air flow and 80º d.b./67º w.b. entering air temperature in cooling, 70º d.b. entering air temperature in heating. Heating data at entering fluid
temperatures below 50º assumes the use of antifreeze.
As a result of continuing research and development, specifications are subject to change without notice.
OPERATING DATA
COOLING HEATING
E
NTERING WATER SUCTION DISCHARGE WATER AIR SUCTION DISCHARGE WATER AIR
MODEL WATER FLOW PRESSURE PRESSURE TEMP TEMP PRESSURE PRESSURE TEMP TEMP
TEMP. ˚F GPM PSIG PSIG RISE ˚F DROP ˚F PSIG PSIG DROP ˚F RISE ˚F
AP071
Full
Load
30˚
40˚
50˚
60˚
70˚
80˚
90˚
100˚
9.0 71-87 259-316 5-7 19-23
18.0 76-92 264-322 4-5 20-25
9.0 120-146 185-225 15-19 21-26 84-102 280-342 7-8 22-26
18.0 117-142 173-211 11-14 22-27 89-108 286-349 5-6 23-28
9.0 123-150 218-266 15-18 20-25 96-117 302-368 8-9 24-29
18.0 120-146 204-249 11-14 21-26 102-124 308-376 6-7 25-31
9.0 126-153 251-307 14-17 20-24 109-132 324-395 9-11 26-32
18.0 122-149 235-287 11-13 21-25 116-141 330-403 7-8 28-34
9.0 129-157 285-347 14-17 19-24 121-148 345-421 10-12 29-35
18.0 125-152 266-325 10-13 20-25 129-157 352-430 8-9 30-37
9.0 132-160 318-388 13-16 19-23 134-163 367-447 11-14 31-38
18.0 128-156 297-363 10-12 19-24 142-173 374-457 8-10 33-40
9.0 135-164 351-429 13-16 18-22 146-178 388-474 12-15 33-41
18.0 131-159 329-401 10-12 19-23 155-189 396-483 9-11 35-43
9.0 137-167 385-469 12-15 17-21
18.0 134-163 360-439 9-11 18-22