From October 2009 QST © ARRL
center of the Panadapter is the VFO frequency.
The green rectangle represents the filter pass-
band. The X-axis of the grid is frequency and
the Y-axis is signal level, here from –160 to
–20 dBm.
The Waterfall shows a colorized view of
signal strength as a function of frequency
for all frequencies within the current pass-
band. Signal levels, timing and color are all
configurable. The Panafall is a combination
format with a traditional panadapter screen
on the upper half of the display and a PSK31
style waterfall on the lower half. This format
is useful for locating weak signals that are not
obvious with the panadapter alone.
The Scope format shows a classic oscil-
loscope display of whatever signal is within
the filter passband. Interestingly, I found the
Scope was able to “print out” the code of a
CW signal. The feature could be useful for
the hearing impaired. The Panascope format
shows both the Panadapter and Scope.
Spectrum displays signal levels within the
selected filter’s bandwidth. Signal activity in
the IF passband outside of the filter bandwidth
is not shown. The Histogram display is es-
sentially a colorized version of the spectrum
display. Blue represents the signals levels
within the filter passband that are below the
average level. Red represents those that exceed
the average level and green is a peak reading
function.
The Phase format maps the I and Q chan-
nels to the X and Y axis of the display. The I
and Q channels represent the incoming signal
split into two components separated by 90°.
These displays are useful for testing.
In the Spectrum, Panadapter, Waterfall and
Histogram formats you can add an averaging
function, a peak hold function or a combina-
tion of both. In particular the averaging func-
tion was useful with the Panadapter. I found
00.020.040.060.080.1
QS0910-Prodrev03
-100
-80
-60
-40
-20
0
QS0910-Prodrev04
f
c
+1 +3 +5-1-3-5
QS0910-Prodrev05
1x10
2
1x10
3
1x10
4
1x10
5
1x10
6
-180
-160
-140
-120
-100
-80
-60
-40
-20
0
that normal band noise caused the Panadapter
display to be so variable that only strong sig-
nals were visibly evident. Weak signals are
buried in the visual static more effectively than
in the audio static. In tuning across the band I
was often surprised to hear a low level signal
from the speakers that I could not make out
on the display.
Applying the AVG filter reduces the dis-
play’s visual agitation and causes signals to
become more evident, but the general agitation
caused by noise still tends to cover weaker sig-
nals. Appling the PEAK filter tends to dampen
the visual noise and causes weaker signals to
become more evident, but the level tends to
rise over time and static crashes tend to “lift”
the entire baseline, which then disguises many
weak and even moderate signals.
I am predominately a phone operator and I
found the Panadapter and Panafall displays the
most useful and the Spectrum and Histogram
displays the least useful. For general operating
the Panadapter allows you a view of a broad
swath of the band. You can identify not only
the frequency but also, to some extent, the
type of signal.
On the Panadapter I was unable to distin-
guish between the visual display of the noise
and a weak signal. The Panafall display helps
here in that a weak signal is more evident on
the waterfall display. I wouldn’t go so far as to
say that your ears are obsolete, though. If you
are looking for weak ones, slow tuning with
the mouse wheel and a good set of headphones
is probably the best solution.
Frequency Control
The ’3000 has two separate VFOs, A and
B. These VFOs are represented by two text
boxes. Each VFO text box is divided into two
rows and has a TX button. The upper row indi-
cates the frequency down to 1 Hz. The bottom
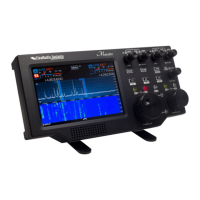
Figure 2 — The PowerSDR front console screen includes all necessary radio controls as
well as a prominent spectrum display that offers several distinct modes. See the text for
a detailed description.
Figure 3 — CW keying waveform for the
FLEX-3000 showing the first two dits in
full-break-in (QSK) mode using external
keying. Equivalent keying speed is
60 WPM. The upper trace is the actual
key closure; the lower trace is the RF
envelope. (Note that the first key closure
starts at the left edge of the figure.)
Horizontal divisions are 10 ms. The
transceiver was being operated at 100 W
output on the 14 MHz band.
Figure 4 — Spectral display of the FLEX-
3000 transmitter during keying sideband
testing. Equivalent keying speed is
60 WPM using external keying. Spectrum
analyzer resolution bandwidth is 10 Hz,
and the sweep time is 30 seconds. The
transmitter was being operated at 100 W
PEP output on the 14 MHz band, and this
plot shows the transmitter output ±5 kHz
from the carrier. The reference level is
0 dBc, and the vertical scale is in dB.
Figure 5 — Spectral display of the FLEX-
3000 transmitter output during composite-
noise testing. Power output is 100 W on the
14 MHz band. The carrier, off the left edge
of the plot, is not shown. This plot shows
composite transmitted noise 100 Hz to
1 MHz from the carrier. The reference level
is 0 dBc, and the vertical scale is in dB.
 Loading...