Calibrating the Color Tone
229
3
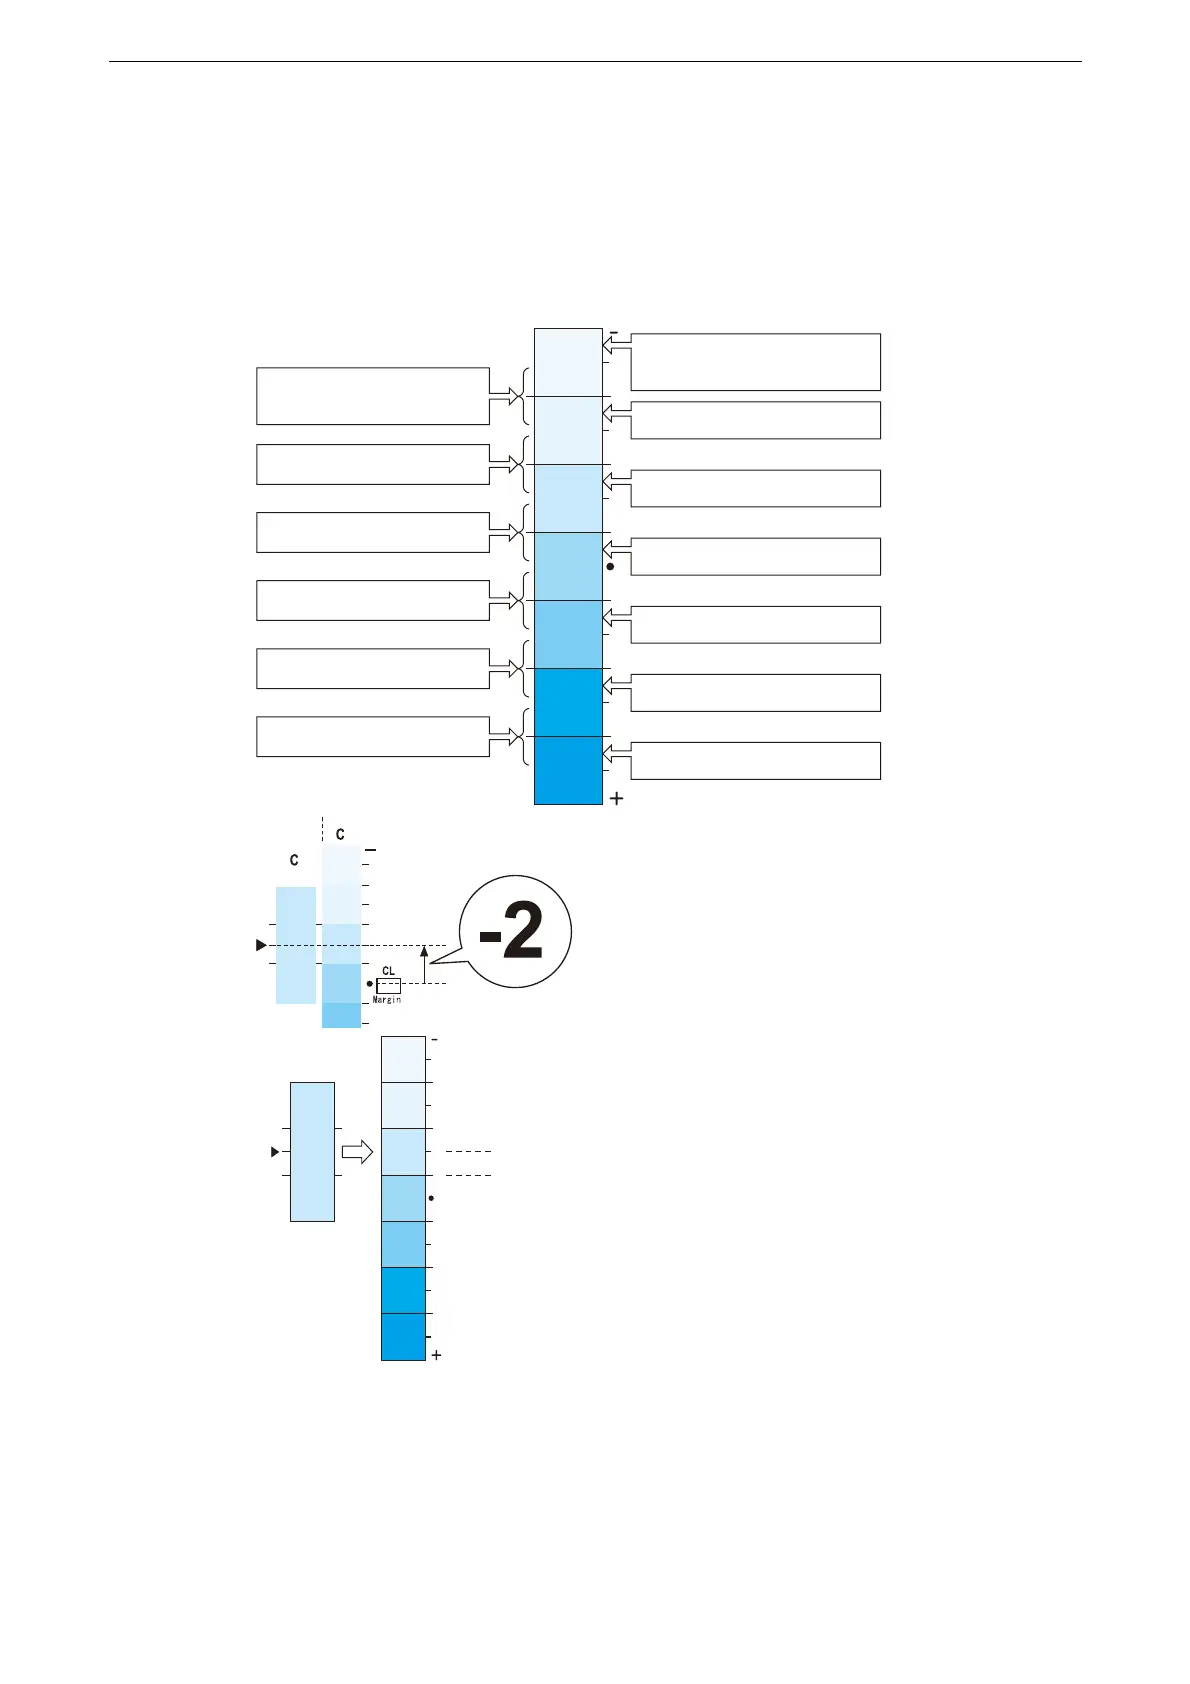
Using the black dot symbol on the halftone adjustment chart as the starting point, slide the
halftone adjustment chart vertically to read the variance with the color samples for
halftone adjustment from the tick marks.
Read the variance while noting the orientation of the - and + marks.
4
Write the variance in the corresponding [Margin] box.
5
In a similar manner, also read the variance of the same color with two other densities.
6
Repeat steps 1 through 5 to read the variance for the remaining YMCK colors in the same
manner.
Measurement part of Calibration Chart
<-5> if density of Color Sample is
close the density in-between.
<-3> if it is close the density
in-between.
<-1> if it is close the density
in-between.
<+1> if it is close the density
in-between.
<+3> if it is close the density
in-between.
<+5> if it is close the density
in-between.
<-6> if density of Color Sample is
close the density here.
<-4> if it is close the density here.
<-2> if it is close the density here.
<0> if it is close the density here.
<+2> if it is close the density here.
<+4> if it is close the density here.
<+6> if it is close the density here.
Color Sample
"-2"
"-1"
A
For the example on the left, density of the
Calibration Chart close to the Color Sample
is at the second position in the negative
direction from the central position or density
A, therefore, the difference is <-2>.
 Loading...