Made in Germany
© Gigahertz Solutions GmbH - 23 - May 2017
Navigation within the Plotted Data
Within the plotted data you can easily navigate using a
mouse and its scroll wheel. Move the mouse pointer into the
data plot. The scale of the x-axis will be
zoomed in when scrolling up or by using the “Up Arrow”,
zoomed out when scrolling down or by using the “Down
Arrow”
centered around the clock time indicated by the position
of the mouse
The data area can be repositioned on the x-axis by a left
mouse click hold and drag left or right. You may just as well
use the “right” and “left” arrows of the keyboard. Zooming of
the time on the x-axis is also possible via the “View” menu.
Scaling of the y-axis is done automatically by default but
can be adjusted manually if desired through the “View”
menu under “Y-Scale”. You can also adapt the scaling of the
y-axis manually via the menu (under “View / Scale”).
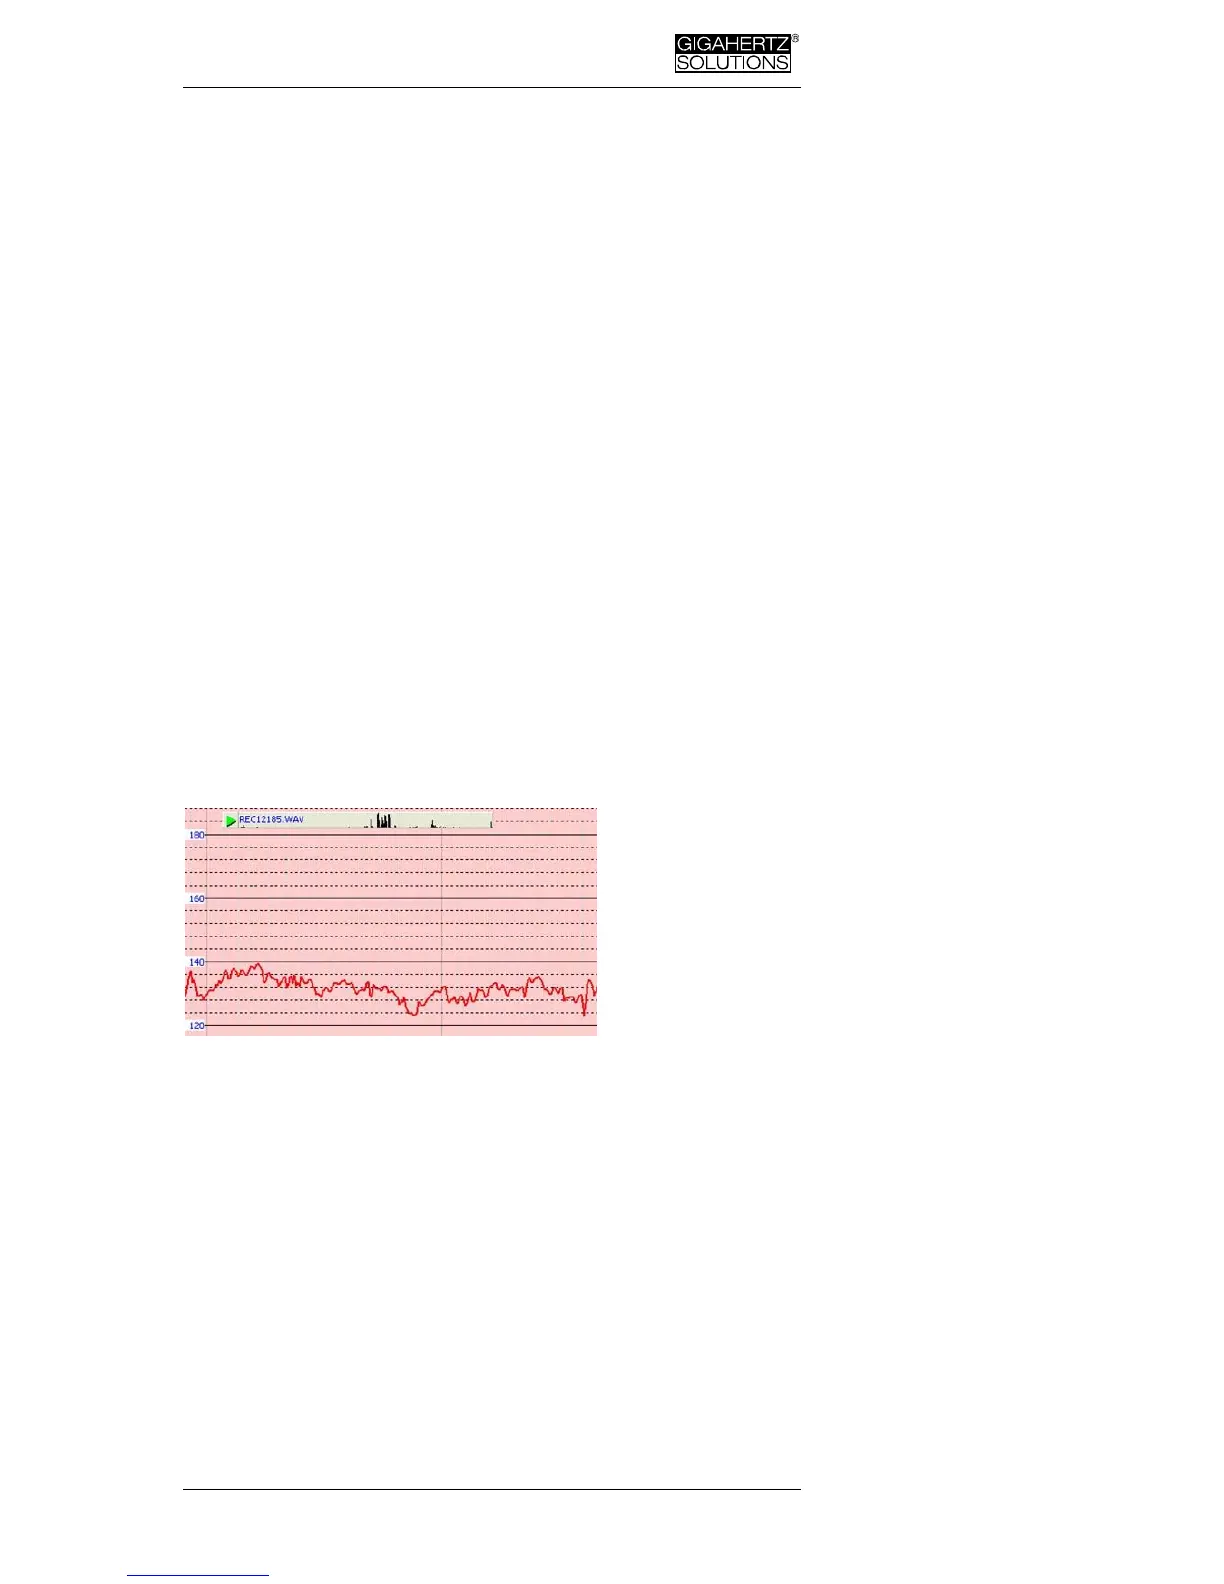
Listening to the Audio Notes
Audio notes dic-
tated during
measurement or
longterm record-
ings are shown in
the diagram di-
rectly at the cor-
responding point
of dictation.
Simply click on them in order to listen to the information
recorded. The audio notes will be played back by the audio
player of your computer. The grey bar on the top will show
the file name and a level preview.
A display of the audio files (.wav) within the diagram is only
possible if they are stored in the same folder as the LOG-file
and if they are not renamed.
Insert Comments directly into the Diagram
Areas of special interest can be commented directly in the
plotted data. Simply position your mouse where you need it,
right click and enter your comments in the comment win-
dow. When you click Ok, the comment will be embedded
into the data, marking an event or section of interest. .
 Loading...