FIG.
58
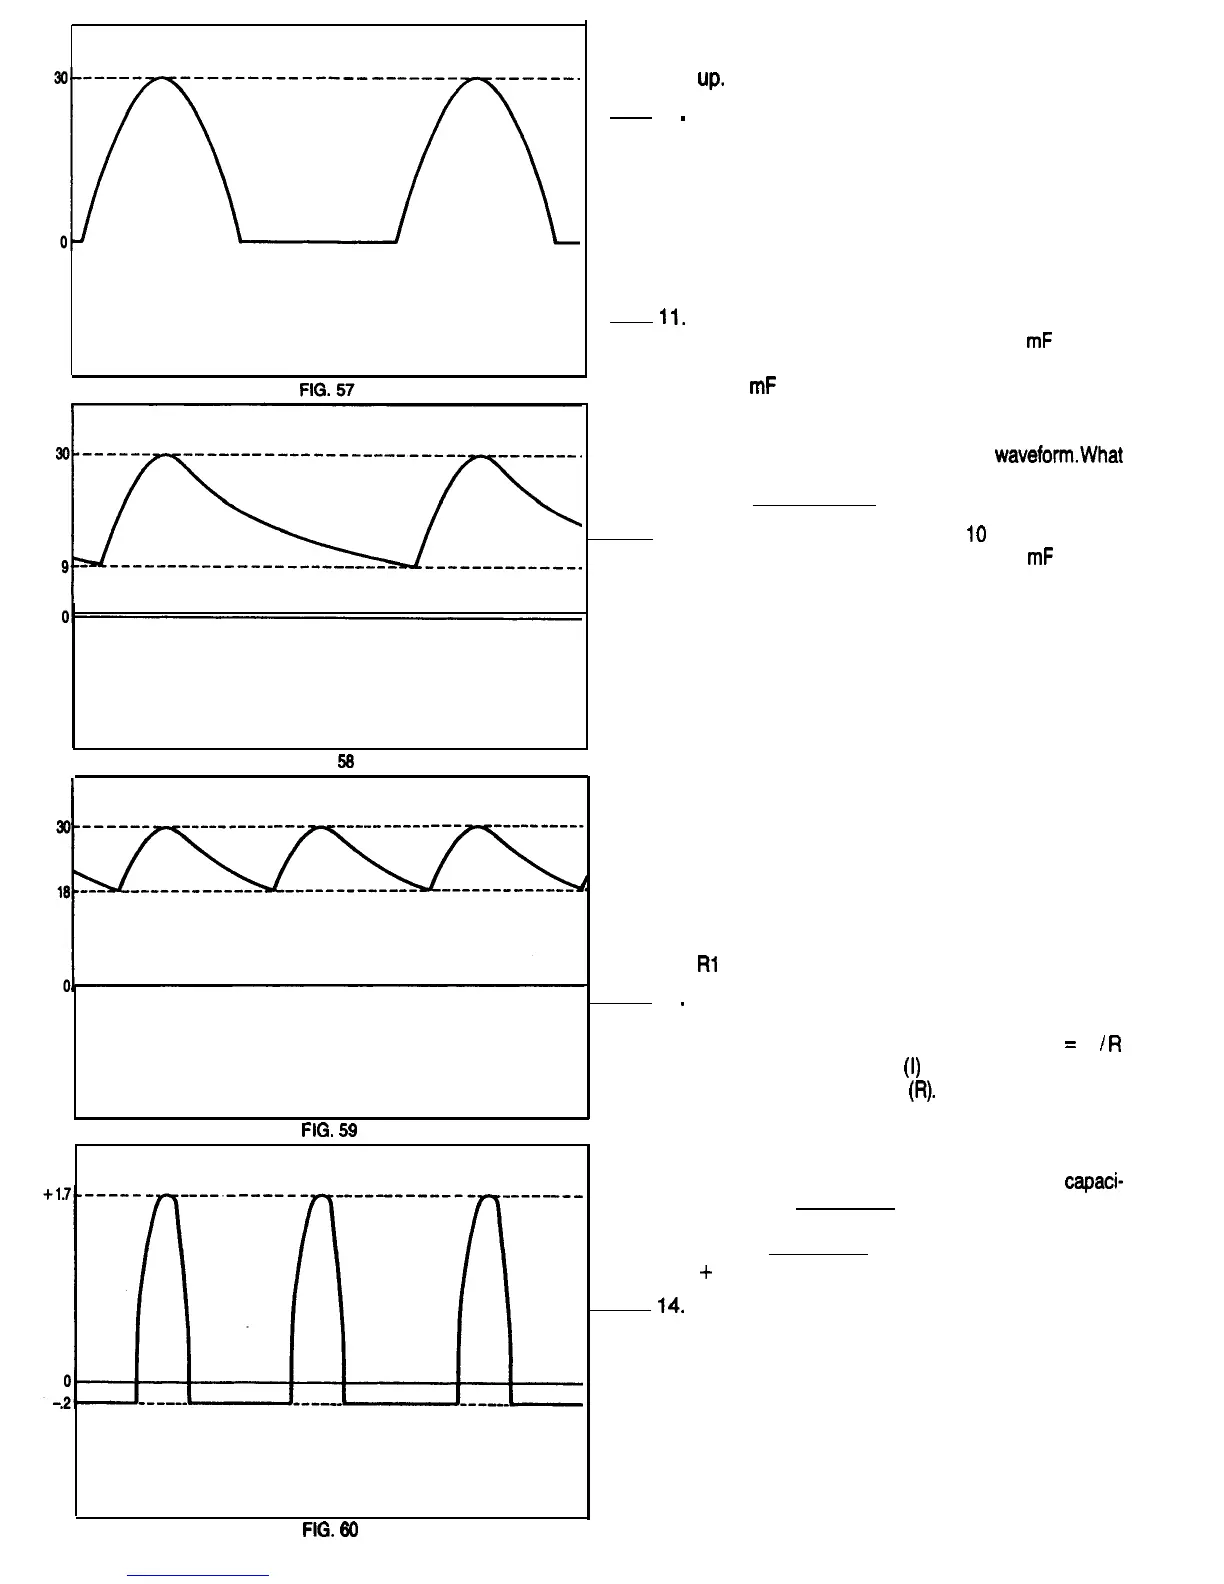
FIG
59
FIG
60
10
.
11.
12.
13
.
14.
this step. Resolder the anode lead of the tempo-
rary D2 diode toTP3. Do not change the test set
“PO
Plug the 808 power plug back into the outlet. The
waveform on the scope should now look Fig. 59.
The peak voltage is still about 30 Volts, but the
minimum voltage has gone up to 18 Volts, and
the peak to peak ripple has gone down to 12
Volts. This shows that the output of a full wave
rectifier is more easily filtered than the output of
a half wave rectifier.
Disconnect the end of the clip lead that is con-
nected to the negative lead of the 10
mF
test ca-
pacitor, and connect it to the negative lead of the
1000
mF
test capacitor. Observe the scope dis-
play. (You may need to readjust the scope trigger
control.) Using a colored pencil, draw this wave-
form on Fig. 59, over the printed
waveform.What
is the approximate peak to peak ripple voltage
now?
Move the Scope probe to the
IO
Ohm test resis-
tor lead that is connected to the 1000
mF
capaci-
tor negative lead by the clip lead. You will need
to change the scope vertical Volts/cm control to
a more sensitive setting, as the voltage devel-
oped across the 10 Ohm resistor by the current
flowing through the test capacitor is quite low.
The waveform displayed on your scope should
look like the one shown in Fig. 60. Notice that
the current flows through the capacitor in short
positive pulses. These current pulses occur
when the instantaneous voltage from the rectifier
diodes exceed the the relatively constant voltage
across the capacitor. It is during these pulses that
the capacitor is charged or, to say it in another
way, that electrical energy is stored in the capaci-
tor. During the longer periods between the posi-
tive current pulses the capacitor discharges, or
gives up electrical energy to the load resistor
Rl
1 and the 10 Ohm current sensing resistor.
We can use Ohm’s law to calculate the current
flowing through the capacitor during the charging
and discharging periods. The formula I
=
E
/
R
will give us the current
(I)
if the voltage (E) is di-
vided by the resistance
(R).
Using -0.2 Volts, the
voltage developed across across the current
sensing test resistor during capacitor discharge
periods, and 10 Ohms, the resistance value of
the current sensing resistor, calculate the
capaci-
torcurrent.
Amps. Calculate the peak
capacitor current during the capacitor charging
period.
Amps. Hint: the voltage is
+
1.7 Volts.
Disconnect the 808 power plug from the power
outlet and the scope probe and ground lead from
your test setup. Unsolder the two capacitors, the
test resistor, the diode and the red wire that were
soldered to test points on the PCB. This com-
pletes the Capacitive Filter Experience. Have
your instructor initial your progress guide.
31
 Loading...