((1/8)9
X
10
10
9
?
CAPACITANCE REQUIRED FOR A
PAFKICULAR
AP
PLICATION
(continued)
With some understanding of
RC
time constants, we can
continue with the capacitive filter calculations that were be-
gun
eariier.The
power transformer and rectifier circuitry for
the positive variable power supply of the 808 are capable
of supplying a full wave pulsating DC voltage of 22.2 peak
Volts at full rated current with a line input voltage of 95
Volts.
For the voltage regulator and overcurrent protection circuit-
ry to maintain an output of
15
Volts at a current of 300
mA,
the voltage from the rectifier will have to be at least 17.1
Volts at all times.The length of time that the capacitive filter
will have to periodically supply power to maintain this mini-
mum voltage is 7.29
mS.
for
50
Hz input power. Refer to
Fig. 63 to review this information. The equivalent load re-
sistance of the fully loaded voltage regulator and
overcurrent circuitry is 54 Ohms.
The formula:
EC
=
Ep
(I
/e)‘Rc
can be rewritten to solve for
C.
-
2.
1
0
*t/T
t
0123456 8 10
15
20
-
-
3
.
4
.
5
l
\
6
.
7.
8
.
FIG.66
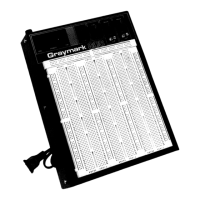
Set the test meter to read a voltage of 10 Volts
DC. Connect the power supply plug to an outlet
and adjust the power supply for a meter reading
of 10 Volts.
Disconnect one of the clip leads from the power
supply, wait 20 seconds and then read the meter.
Put a dot on the blank graph in Fig. 66 where the
voltage you read from the meter and the time you
waited intersect.
Reconnect the clip lead (that was disconnected
in step 4) to the power supply. Notice how rapidly
the capacitor is charged to 10 Volts. This is be-
cause the resistance, or
R,
is now only the clip
lead resistances plus the internal resistance of
the power
supply.The
total of these resistances
is probably less than 100 Ohms.
Repeat steps 4 and 5, using waiting periods of
15,10,8,6,5,4,3,2
and 1 seconds. Place a dot
in the appropriate place on the graph in Fig. 66
each time you repeat steps 4 and 5.
Connect the dots on the graph with a pencil line,
using a
french
curve if possible. Does the graph
you just drew look like the one in Fig.
64?
Be-
cause of the difficulty in reading the meter
accu-
rately
when the voltage is changing rapidly, the
dots you place near the left edge of the graph will
be the least accurate. Also, the capacitance tol-
erances of electrolytic capacitors are large,
typi-
tally
-20%
to
+
5O%.This
could affect the vertical
location of the curve you generated on the graph,
but not necessarily its slope.
Remove the power supply plug from the outlet.
Disconnect the clip leads and the meter test
leads Unsolder the capacitor and resistor leads.
This completes the
IX
Time Constant Experi-
ence- Have your instructor initial your progress
guide.
C
=
R
x In
iE&)
In is the natural log of, in this case,
EdEc.
It can be found
by using a table of natural logarithms or a scientific
calculator.
By expressing
t
in milliseconds and
R
in
kOhms,
C will be
in microfarads. Plugging in these values and solving for C,
we get:
7.29
0.054 x In
(22207.1)
=
“’
”
Is
this the value that should be used for the capacitive filter
for the positive variable supply in the
808?
Because of one
factor that we were not able to evaluate in our empirical de-
sign approach, the answer to that question has to be “no”.
Look at Fig. 60 again. This figure shows the voltage drop
across a current sensing resistor connected between the
rectifier and the capacitive filter. Because of the winding re-
sistance and core losses of the power transformer, and
losses in the rectifier circuitry, the spikes of current that oc-
cur when the capacitive filter is charging will reduce the
voltage available at the rectifier output.
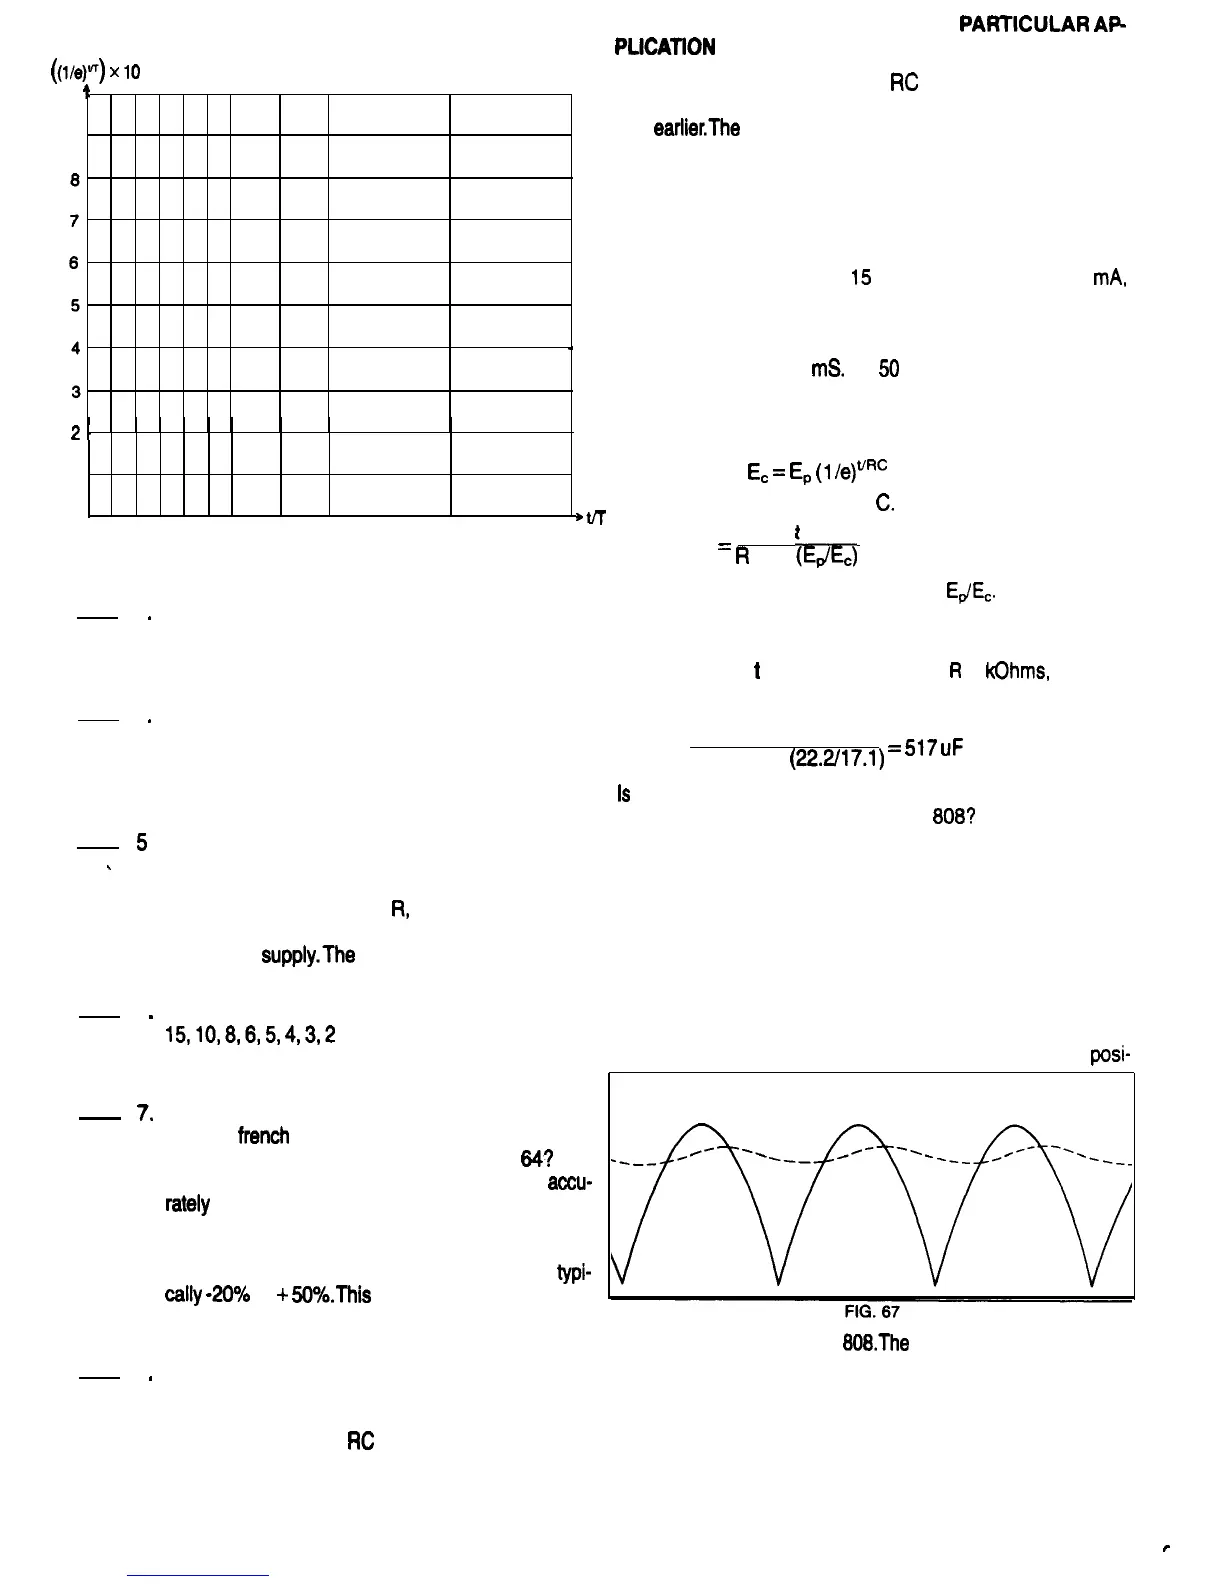
Figure 67 shows the full wave rectifier output for the
posi-
tive variable supply of the
808.The
solid line shows the volt-
age waveform with a resistive load and no capacitive filter.
The dashed line shows the voltage waveform when a ca-
pacitive filter is added. Notice how the voltage peaks are
reduced with the addition of the filter.
To determine the values for the capacitive filters empirical-
ly, trial values for the capacitors must be connected and the
r
i
 Loading...