Version 1.0, 12/2022. Copyright 2012 Hitron Technologies
36
Version 1.0, 12/2022. Copyright 2022 Hitron Technologies
36
Hitron CODA-57/57-EU User’s Guide
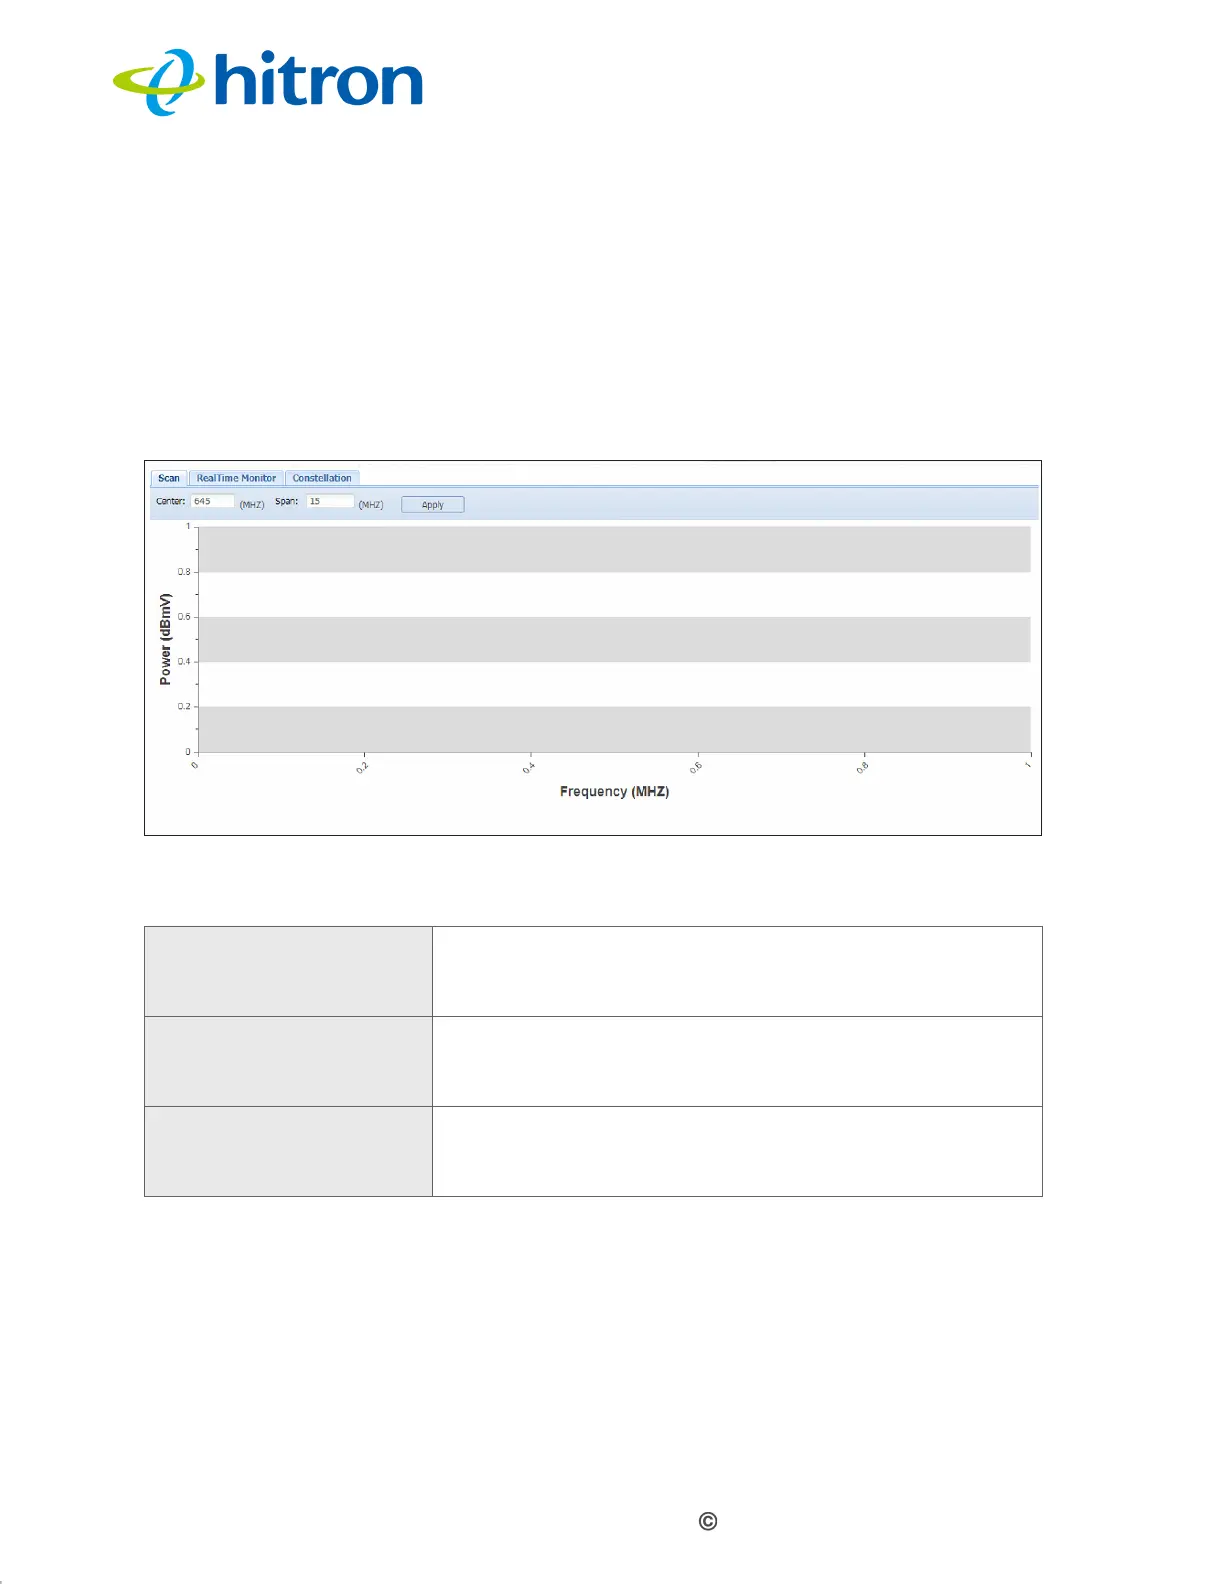
2.7 The Status: Spectrum Screen
Use this screen to examine the radio frequency (RF) spectrum on the cable
connection between the CODA-57/57-EU and the Internet.
Click Status > Spectrum. The following screen displays.
Figure 11: The Status: Spectrum Screen
The following table describes the labels in this screen.
2.7.1 The Spectrum Scan Screen
Use this to perform a scan of RF communications, and view results as a graph of
power against frequency.
Click the Scan tab in the System: Spectrum screen. The following screen displays.
Table 12: The Status: Spectrum Screen
Scan Use this to perform a scan of the RF signal spectrum
and view results. See The Spectrum Scan Screen on
page 36.
RealTime Monitor Use this to observe fluctuations in the RF signal
spectrum as they happen. See The Spectrum RealTime
Monitor Screen on page 37.
Constellation Use this to view a representation of the digitally-
modulated RF signal. See The Spectrum Constellation
Screen on page 38.
 Loading...