MAN-04008-001 Rev. 001 Page 18 of 27
ThinPrep 2000, for the specimens with Reference Diagnosis of ASC-US+ (combined ASC-US, AGUS, LSIL,
ASC-H, HSIL, and Cancer), LSIL+ (combined LSIL, ASC-H, HSIL, and Cancer), ASC-H+ (combined ASC-H,
HSIL, and Cancer) and HSIL+ (combined HSIL and Cancer) were compared.
Clinical Study Results
Tables 20 through 23 present the comparison of Laboratory true positive and negative rates for ASC-US+,
LSIL+, ASC-H+, and HSIL+.
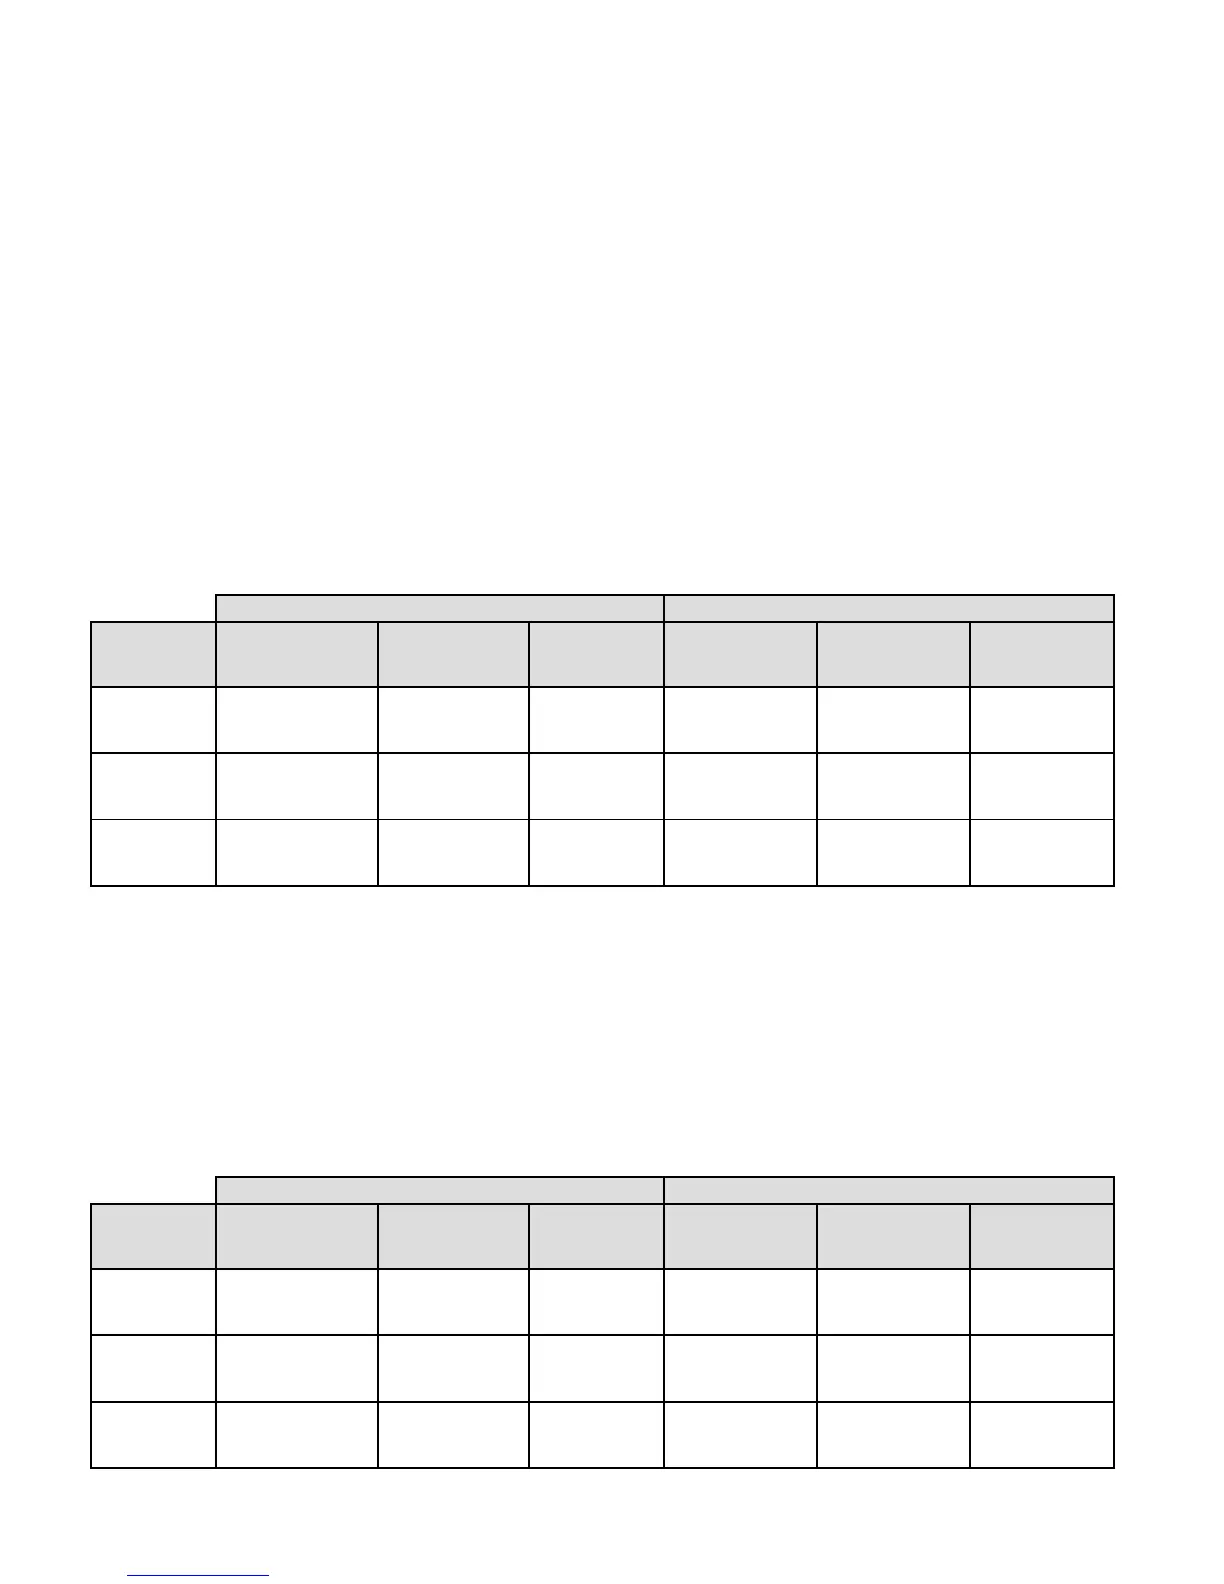
Table 20: Laboratory ThinPrep 5000 Results vs Laboratory ThinPrep 2000 Results for the Specimens
with Reference Diagnosis of ASC-US+
In the study, there were 530 specimens with Reference Diagnosis of ASC-US+ (combined ASC-US, AGUS,
LSIL, ASC-H, HSIL, and Cancer) and 696 specimens with Reference Diagnosis of NILM.
In this table, “Positive” means ASC-US+ or UNSAT, and “Negative” means NILM. All percentages
are rounded to the nearest 0.1%.
ASC‐US+
Positive Percent Agreement Negative Percent Agreement
Lab CT/
Pathologist
ThinPrep 5000
(95% CI)
ThinPrep 2000
(95% CI)
Difference
(95% CI)
ThinPrep 5000
(95% CI)
ThinPrep 2000
(95% CI)
Difference
(95% CI)
#1
90.9%
(482/530)
(88.2% to 93.1%)
89.4%
(474/530)
(86.5% to 91.8%)
1.5%
(8/530)
(-0.7% to 3.8%)
89.1%
(620/696)
(86.5% to 91.2%)
87.9%
(612/696)
(85.3% to 90.1%)
1.1%
(8/696)
(-1.1% to 3.5%)
#2
87.0%
(461/530)
(83.8% to 89.6%)
86.6%
(459/530)
(83.4% to 89.2%)
0.4%
(2/530)
(-2.7% to 3.4%)
88.6%
(617/696)
(86.1% to 90.8%)
90.7%
(631/696)
(88.3% to 92.6%)
-2.0%
(-14/696)
(-4.4% to 0.3%)
#3
87.5%
(464/530)
(84.5% to 90.1%)
88.5%
(469/530)
(85.5% to 90.9%)
-0.9%
(-5/530)
(-3.7% to 1.8%)
87.6%
(610/696)
(85.0% to 89.9%)
88.1%
(613/696)
(85.5% to 90.3%)
-0.4%
(-3/696)
(-2.9% to 2.0%)
Table 21: Laboratory ThinPrep 5000 Results vs Laboratory ThinPrep 2000 Results for the Specimens
with Reference Diagnosis of LSIL+
In the study, there were 387 specimens with Reference Diagnosis of LSIL+ (combined LSIL, ASC-H, HSIL, and
Cancer) and 839 specimens with Reference Diagnosis of (combined NILM, ASC-US, and AGUS).
In this table, “Positive” means LSIL+ or UNSAT, and “Negative” means NILM or ASC-US/AGUS.
All percentages are rounded to the nearest 0.1%.
LSIL+
Positive Percent Agreement Negative Percent Agreement
Lab CT/
Pathologist
ThinPrep 5000
(95% CI)
ThinPrep 2000
(95% CI)
Difference
(95% CI)
ThinPrep 5000
(95% CI)
ThinPrep 2000
(95% CI)
Difference
(95% CI)
#1
84.8%
(328/387)
(80.8% to 88.0%)
86.8%
(336/387)
(83.1% to 89.8%)
-2.1%
(-8/387)
(-5.9% to 1.7%)
90.3%
(758/839)
(88.2% to 92.2%)
89.5%
(751/839)
(87.3% to 91.4%)
0.8%
(7/839)
(-1.1% to 2.8%)
#2
84.0%
(325/387)
(80.0% to 87.3%)
83.5%
(323/387)
(79.4% to 86.8%)
0.5%
(2/387)
(-3.6% to 4.6%)
91.7%
(769/839)
(89.6% to 93.3%)
91.4%
(767/839)
(89.3% to 93.1%)
0.2%
(2/839)
(-1.7% to 2.2%)
#3
84.0%
(325/387)
(80.0% to 87.3%)
87.3%
(338/387)
(83.7% to 90.3%)
-3.4%
(-13/387)
(-7.4% to 0.6%)
88.6%
(743/839)
(86.2% to 90.5%)
89.4%
(750/839)
(87.1% to 91.3%)
-0.8%
(-7/839)
(-2.9% to 1.2%)
 Loading...