EasyManua.ls Logo

HP 10bII

HP 10bII
145 pages
To Next Page IconTo Next Page
To Previous Page IconTo Previous Page
Loading...
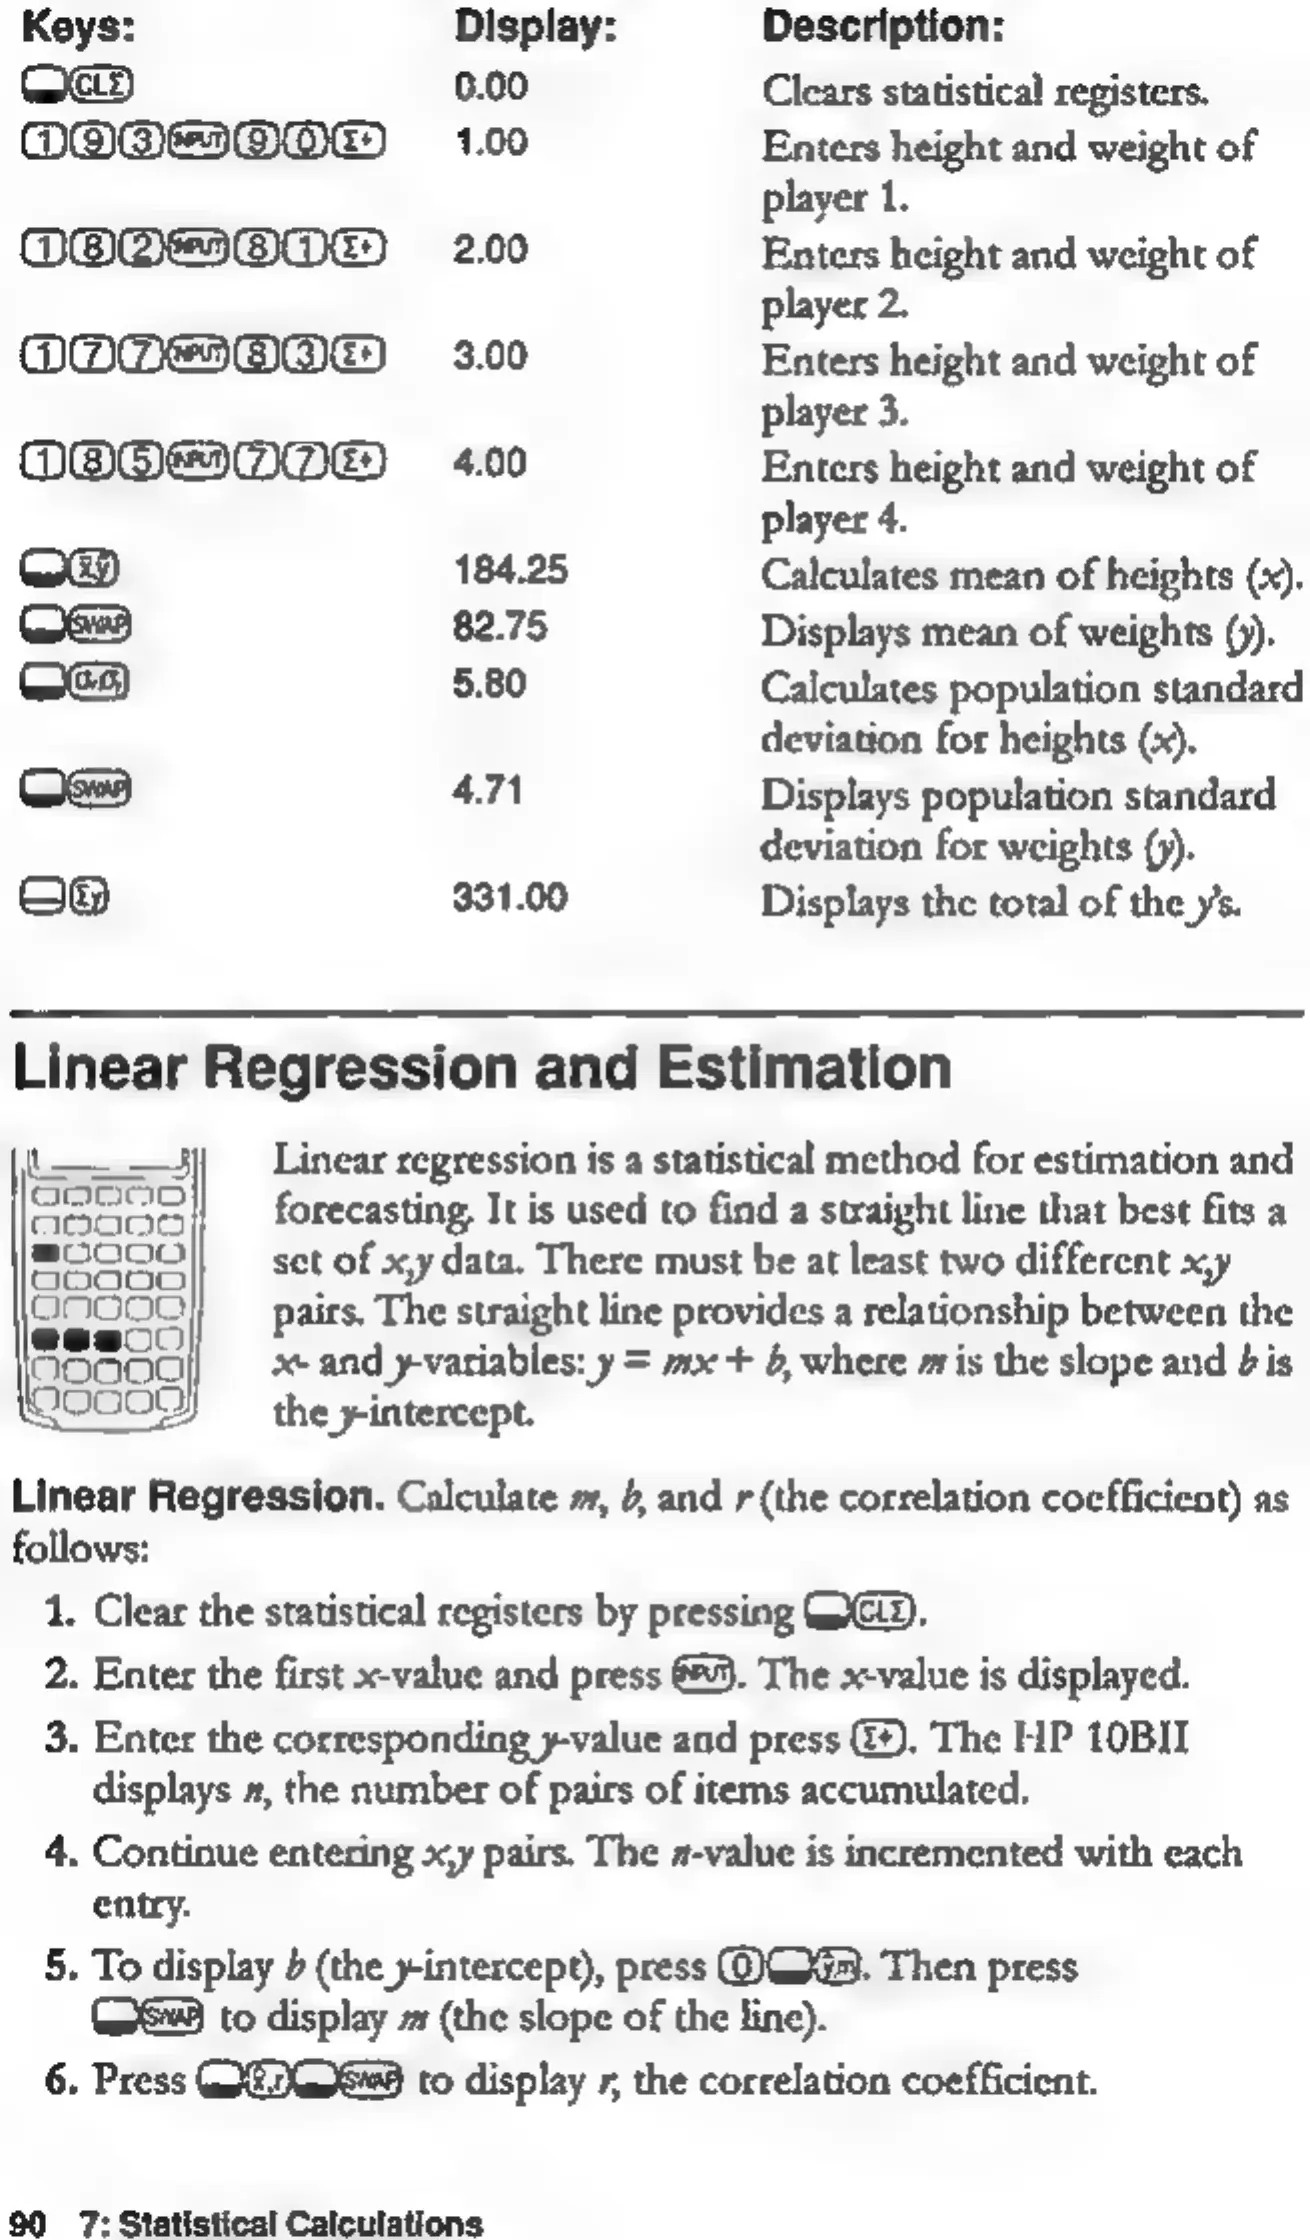
Keys:
Display:
Qa»
0.00
@@(@@®(@(@@
100
CO(BXZe»(8900G9
2.00
COCOCDee»
(G9
3.00
ФОСЛ)
4.00
[m6]
184.25
ватт
82.75
[mcm
5,80
Om
471
eu
331.00
Description:
Clears
statistical
registers.
Enters
height
and
weight
of
player
1.
Enters
height
and
weight
of
player
2.
Enters
height
and
weight
of
player
3.
Enters
height
and
weight
of
player
4.
Calculates
mean
of
heights
(x).
Displays
mean
of
weights
()).
Calculates
population
standard
deviation
for
heights
(x).
Displays
population
standard
deviation
for
weights
(у).
Displays
thc
total
of
ће
y's.
Linear
Regression
and
Estimation
the
y-intercept.
Linear
regression
is
a
statistical
method
for
estimation
and
forecasting,
It
is
used
to
find
a
straight
line
that
best
fits
a
set
of
xy
data.
There
must
be
at
least
two
different
xy
pairs.
The
straight
line
provides
a
relationship
between
the
x-
and
y-variables:
y
=
mx
+
b,
where
m
is
the
slope
and
bis
Linear
Regression.
Calculate
э,
b,
and
r
(the
correlation
coefficient)
as
follows:
1.
Clear
the
statistical
registers
by
pressing
БӘСІ).
2.
Enter
the
first
x-value
and
press
68).
The
x-value
is
displayed.
3.
Enter
the
corresponding
y-value and
press
Œ).
The
НР
10BII
displays
л,
the
number
of
pairs
of
items
accumulated.
4.
Continue
entering
x,y
pairs.
The
#-value
is
incremented
with
each
entry.
5.
To
display
P
(the
y-intercept),
press
OQA.
Then
press
to
display
»
(the
slope
of
the
line).
6.
Press
ENE
to
display
7,
the
correlation
coefficient.
90
7:
Statistical
Calculations

Table of Contents

Other manuals for HP 10bII

Related product manuals