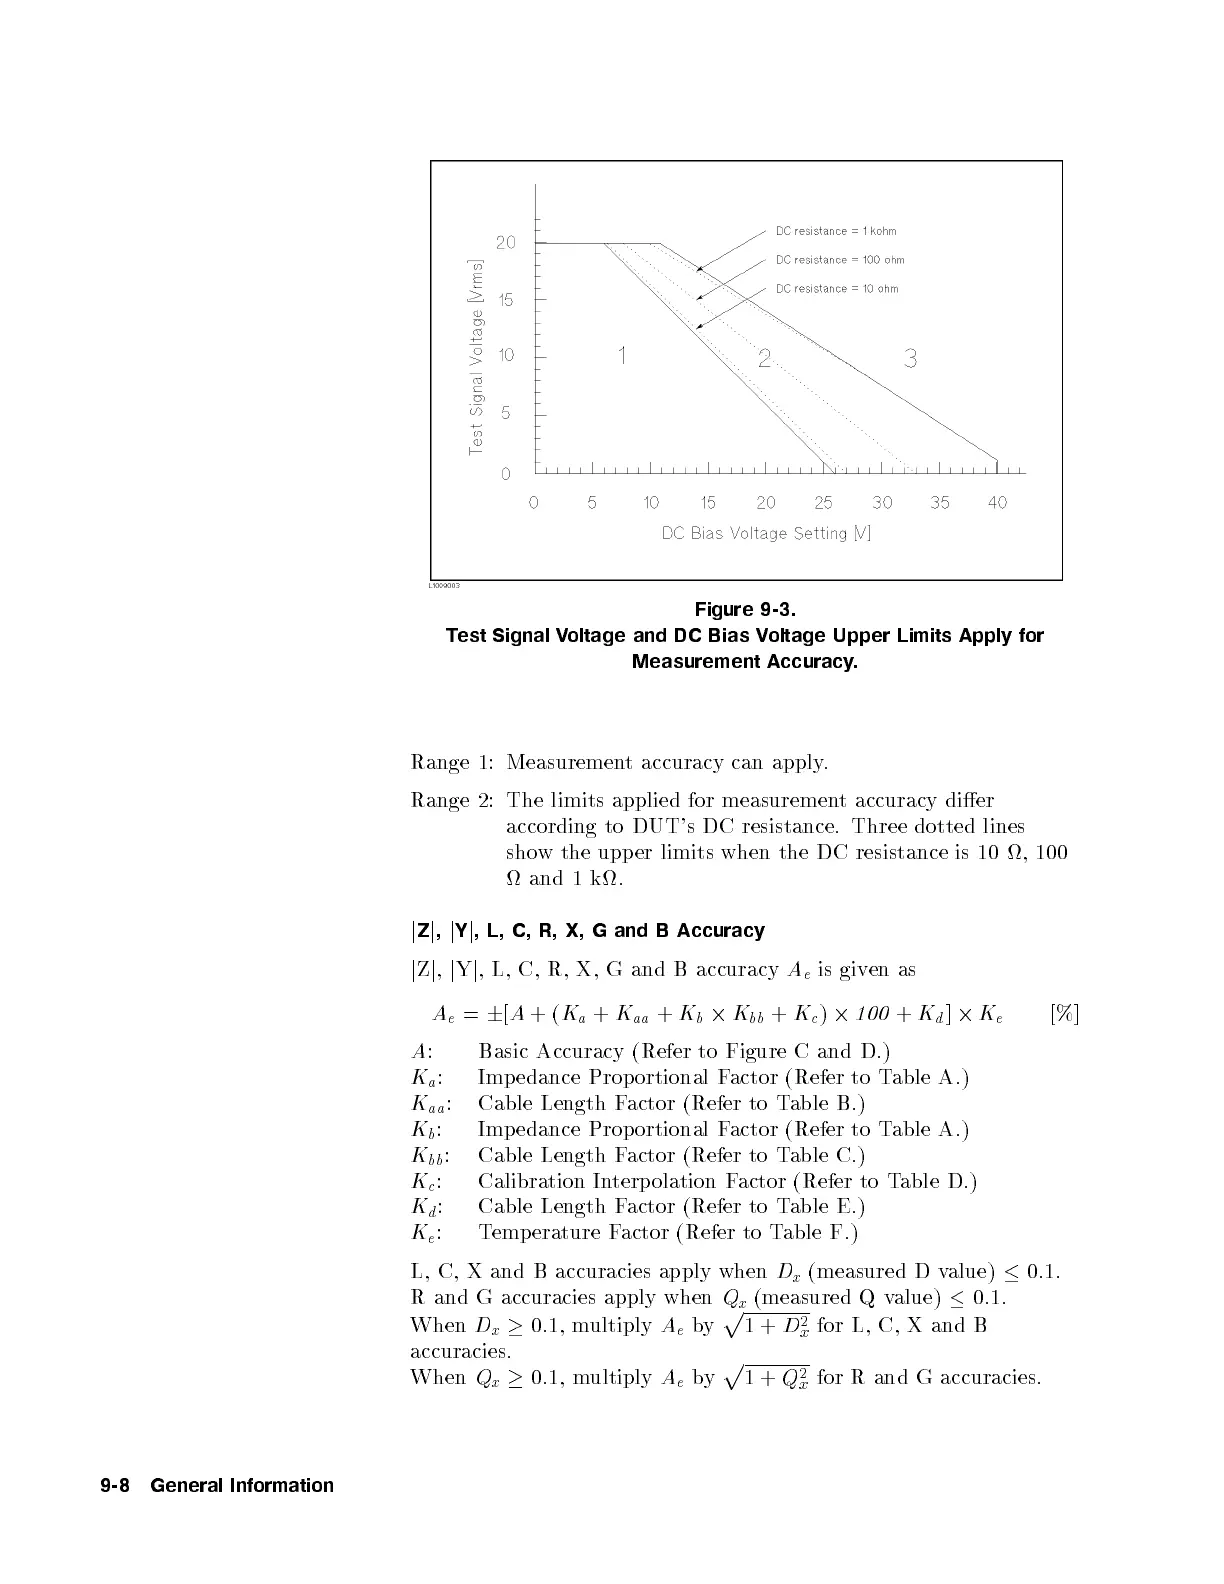
Figure 9-3.
Test Signal Voltage and DC Bias Voltage Upper Limits Apply for
Measurement Accuracy.
Range 1: Measurement accuracy can apply.
Range 2: The limits applied for measurement accuracy dier
according to DUT's DC resistance. Three dotted lines
show the upper limits when the DC resistance is 10 , 100
and 1 k.
j
Z
j
,
j
Y
j
, L, C, R, X, G and B Accuracy
j
Z
j
,
j
Y
j
, L, C, R, X, G and B accuracy
A
e
is given as
A
e
=
6
[
A
+(
K
a
+
K
aa
+
K
b
2
K
bb
+
K
c
)
2
100
+
K
d
]
2
K
e
[%]
A
: Basic Accuracy (Refer to Figure C and D.)
K
a
: Impedance Proportional Factor (Refer to Table A.)
K
aa
: Cable Length Factor (Refer to Table B.)
K
b
: Impedance Prop ortional Factor (Refer to Table A.)
K
bb
: Cable Length Factor (Refer to Table C.)
K
c
: Calibration Interp olation Factor (Refer to Table D.)
K
d
: Cable Length Factor (Refer to Table E.)
K
e
: Temp erature Factor (Refer to Table F.)
L, C, X and B accuracies apply when
D
x
(measured D value)
0.1.
R and G accuracies apply when
Q
x
(measured Q value)
0.1.
When
D
x
0.1, multiply
A
e
by
p
1+
D
2
x
for L, C, X and B
accuracies.
When
Q
x
0.1, multiply
A
e
by
p
1+
Q
2
x
for R and G accuracies.
9-8 General Information


 To Next Page