13. DISPLAYED AVERAGE NOISE LEVEL TEST (SA)
Description
This test uses the HP 4395A marker statistics function to measure the displayed average noise
level in the HP 4395A spectrum analyzer mode.
In this test, the noise level (trace mean value) is measured in linear format [Watt]. Then the
measured values are converted to log magnitude format [dBm]. This is done to avoid skewing
the data with the marker statistics function.
Specication
Displayed average noise level
freq.
1 kHz, ref. level
0
40 dBm, att.=0 dB
::: :::: ::::: :::: ::::: :::: :::<
0
120 dBm/Hz
freq.
100 kHz, ref. level
0
40 dBm, att.=0 dB
:::: :::: ::::: :::: ::::: ::: <
0
133 dBm/Hz
freq.
10 MHz, ref. level
0
40 dBm, att.=0 dB
:::: ::::: :::: ::: <
[
0
145+
f
1
/100] dBm/Hz
1:
f
is measurement frequency (MHz).
Test Equipment
50 Termination (three required)
::: :::: ::::: :::: :::::
HP 909C Opt. 012 or part of HP 85032B
Procedure
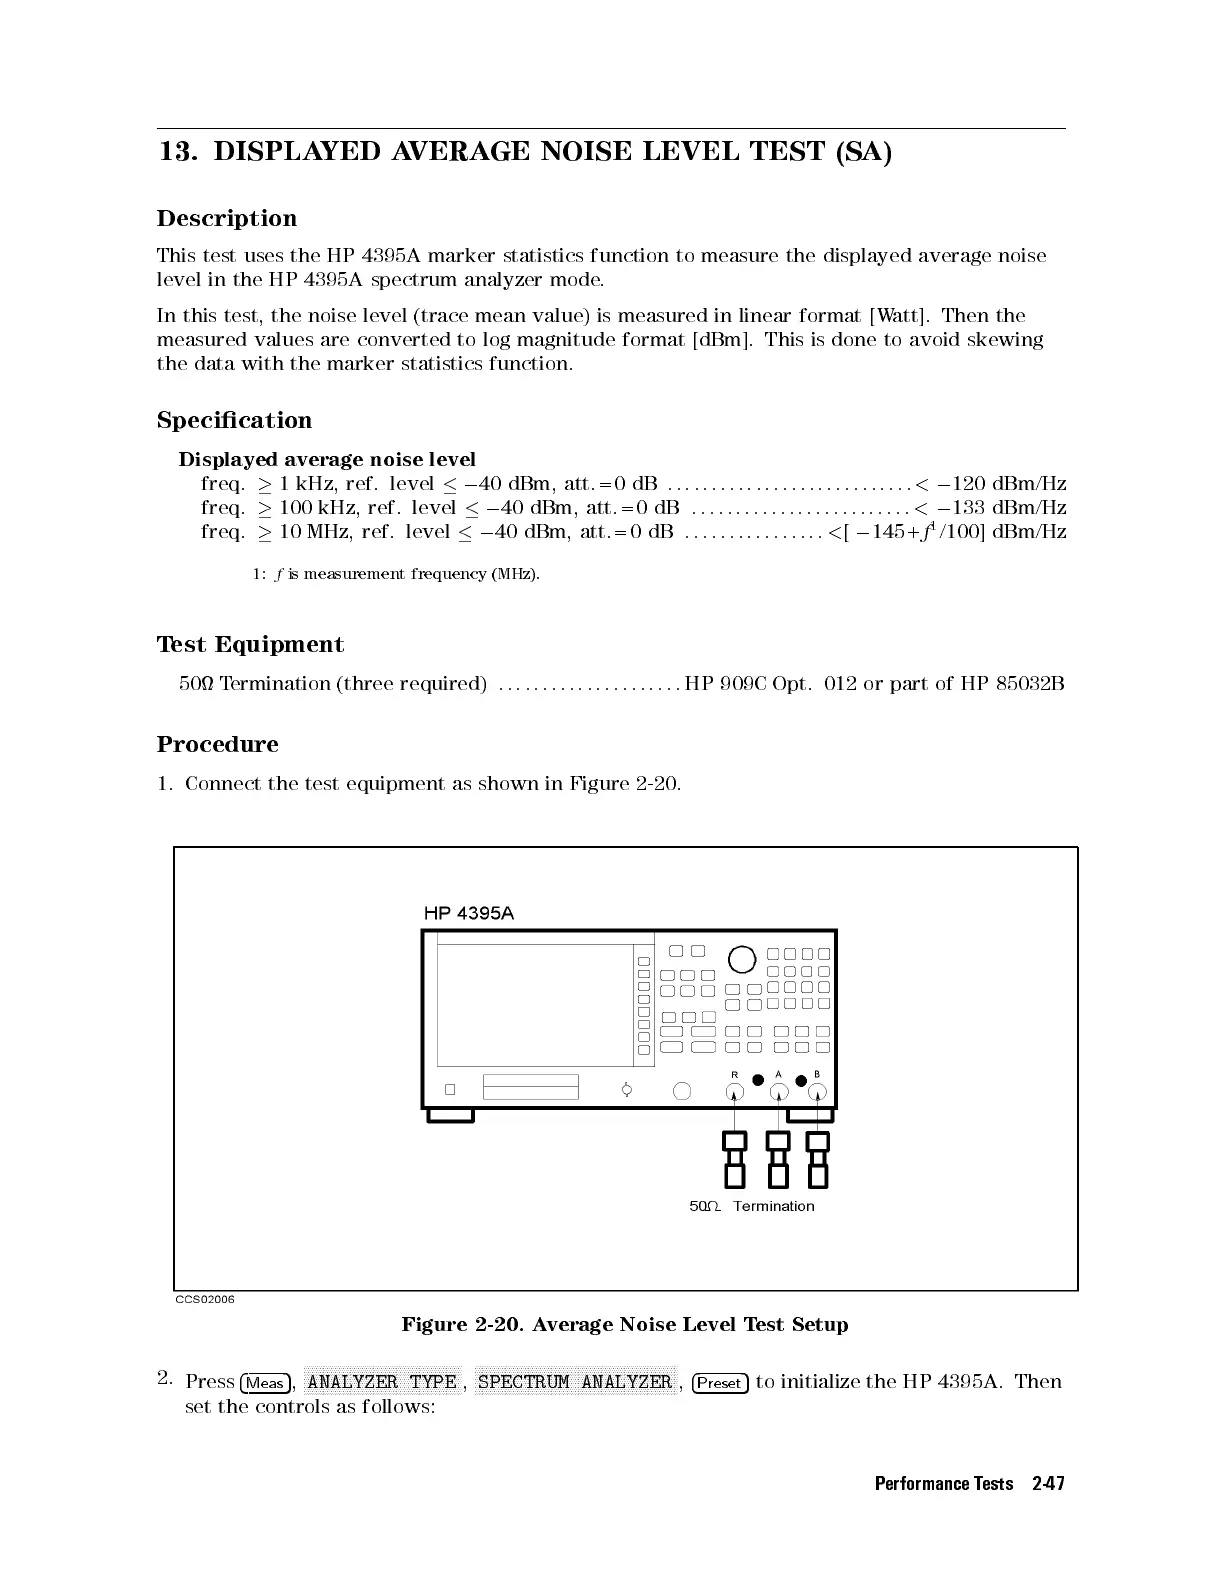
1. Connect the test equipment as shown in Figure 2-20.
Figure 2-20. Average Noise Level Test Setup
2.
Press
4
Meas
5
,
NNNNNNNNNNNNNNNNNNNNNNNNNNNNNNNNNNNNNNNNN
ANALYZER TYPE
,
NNNNNNNNNNNNNNNNNNNNNNNNNNNNNNNNNNNNNNNNNNNNNNNNNNNNN
SPECTRUM ANALYZER
,
4
Preset
5
to initialize the HP 4395A. Then
set the controls as follows:
Performance Tests 2-47
 Loading...