D
8. Repeat the steps a to e at the all the range and level settings shown in the
test record.
9. Calculate the non-linearity using the formulae in the test record.
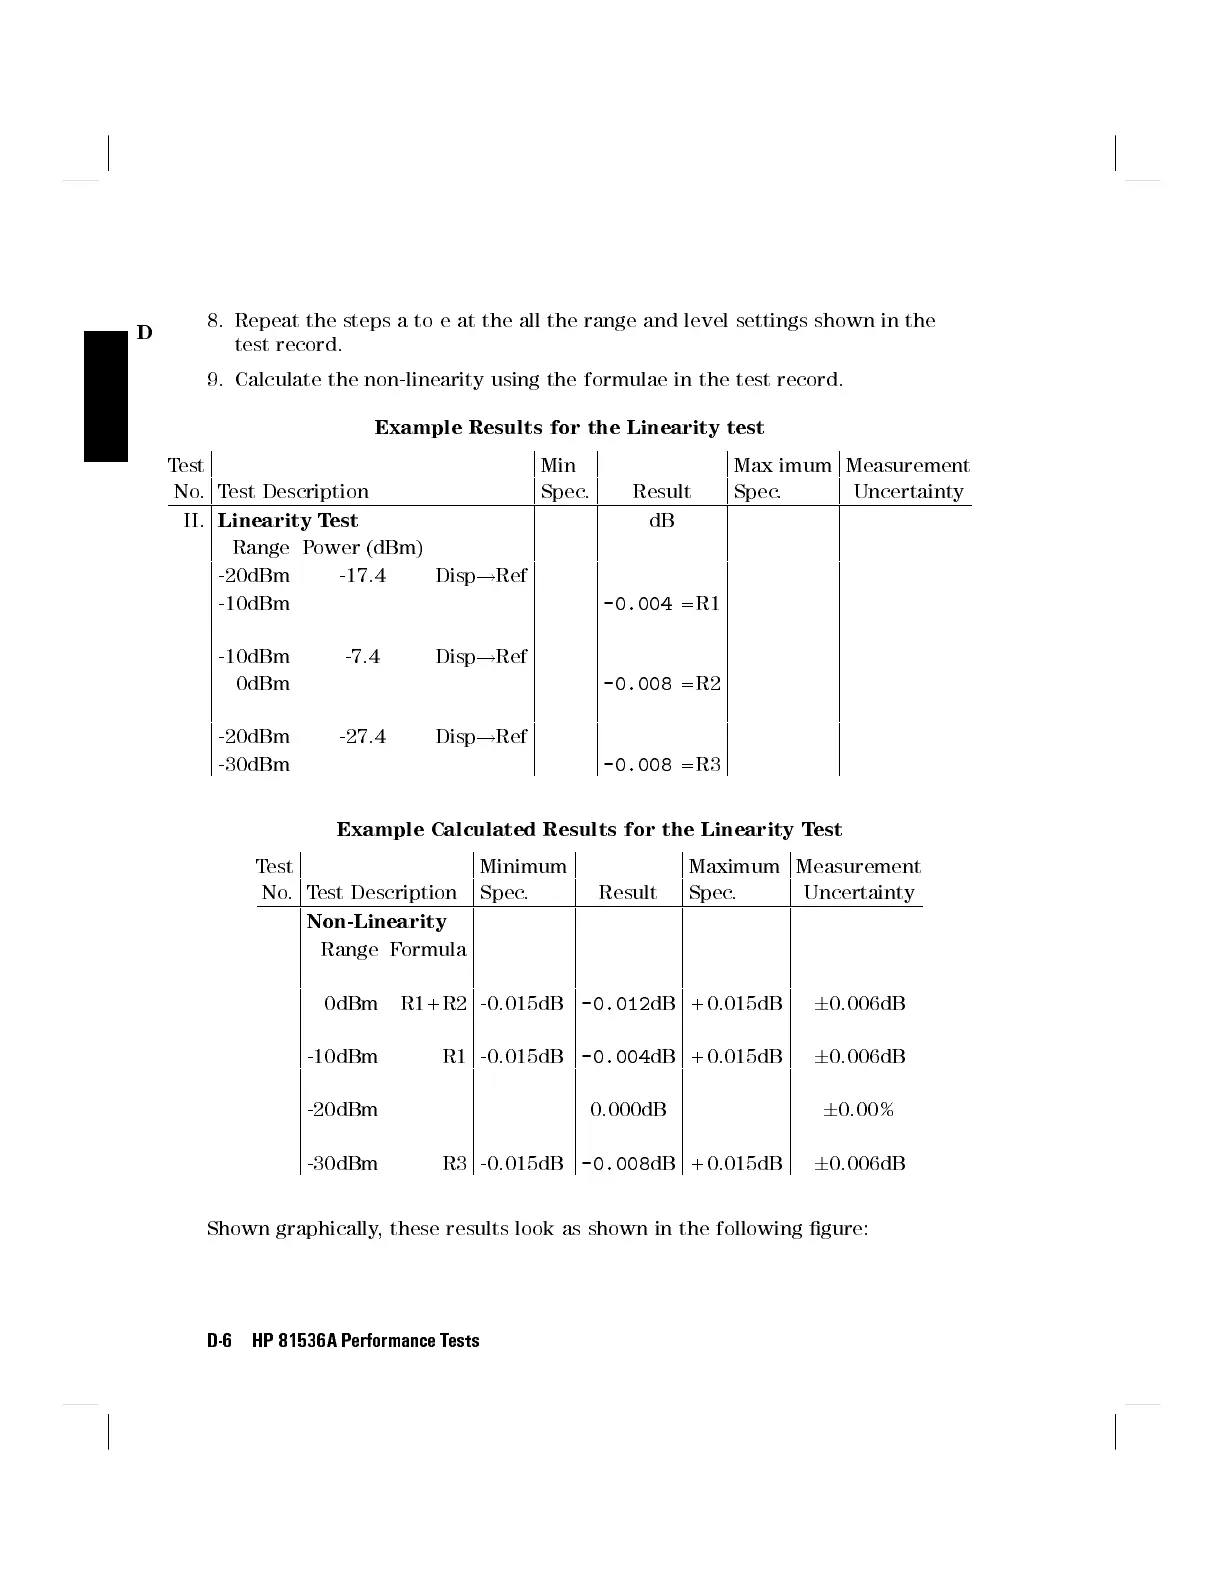
Example Results for the Linearity test
Test Min Max imum Measurement
No.Test Description Spec. Result Spec. Uncertainty
II.
Linearity Test
dB
Range Power (dBm)
-20dBm -17.4 Disp
!
Ref
-10dBm
-0.004
=R1
-10dBm -7.4 Disp
!
Ref
0dBm
-0.008
=R2
-20dBm -27.4 Disp
!
Ref
-30dBm
-0.008
=R3
Example Calculated Results for the Linearity Test
Test Minimum Maximum Measurement
No.Test Description Spec. Result Spec. Uncertainty
Non-Linearity
Range Formula
0dBm R1+R2 -0.015dB
-0.012
dB +0.015dB
6
0.006dB
-10dBm R1 -0.015dB
-0.004
dB +0.015dB
6
0.006dB
-20dBm 0.000dB
6
0.00%
-30dBm R3 -0.015dB
-0.008
dB +0.015dB
6
0.006dB
Shown graphically, these results look as shown in the following gure:
D-6 HP 81536A Performance Tests