EasyManua.ls Logo

HP 8642A - Page 286

HP 8642A
314 pages
To Next Page IconTo Next Page
To Previous Page IconTo Previous Page
Loading...
Performance
Tests
4-36
Model
8642A/B
PERFORMANCE
TESTS
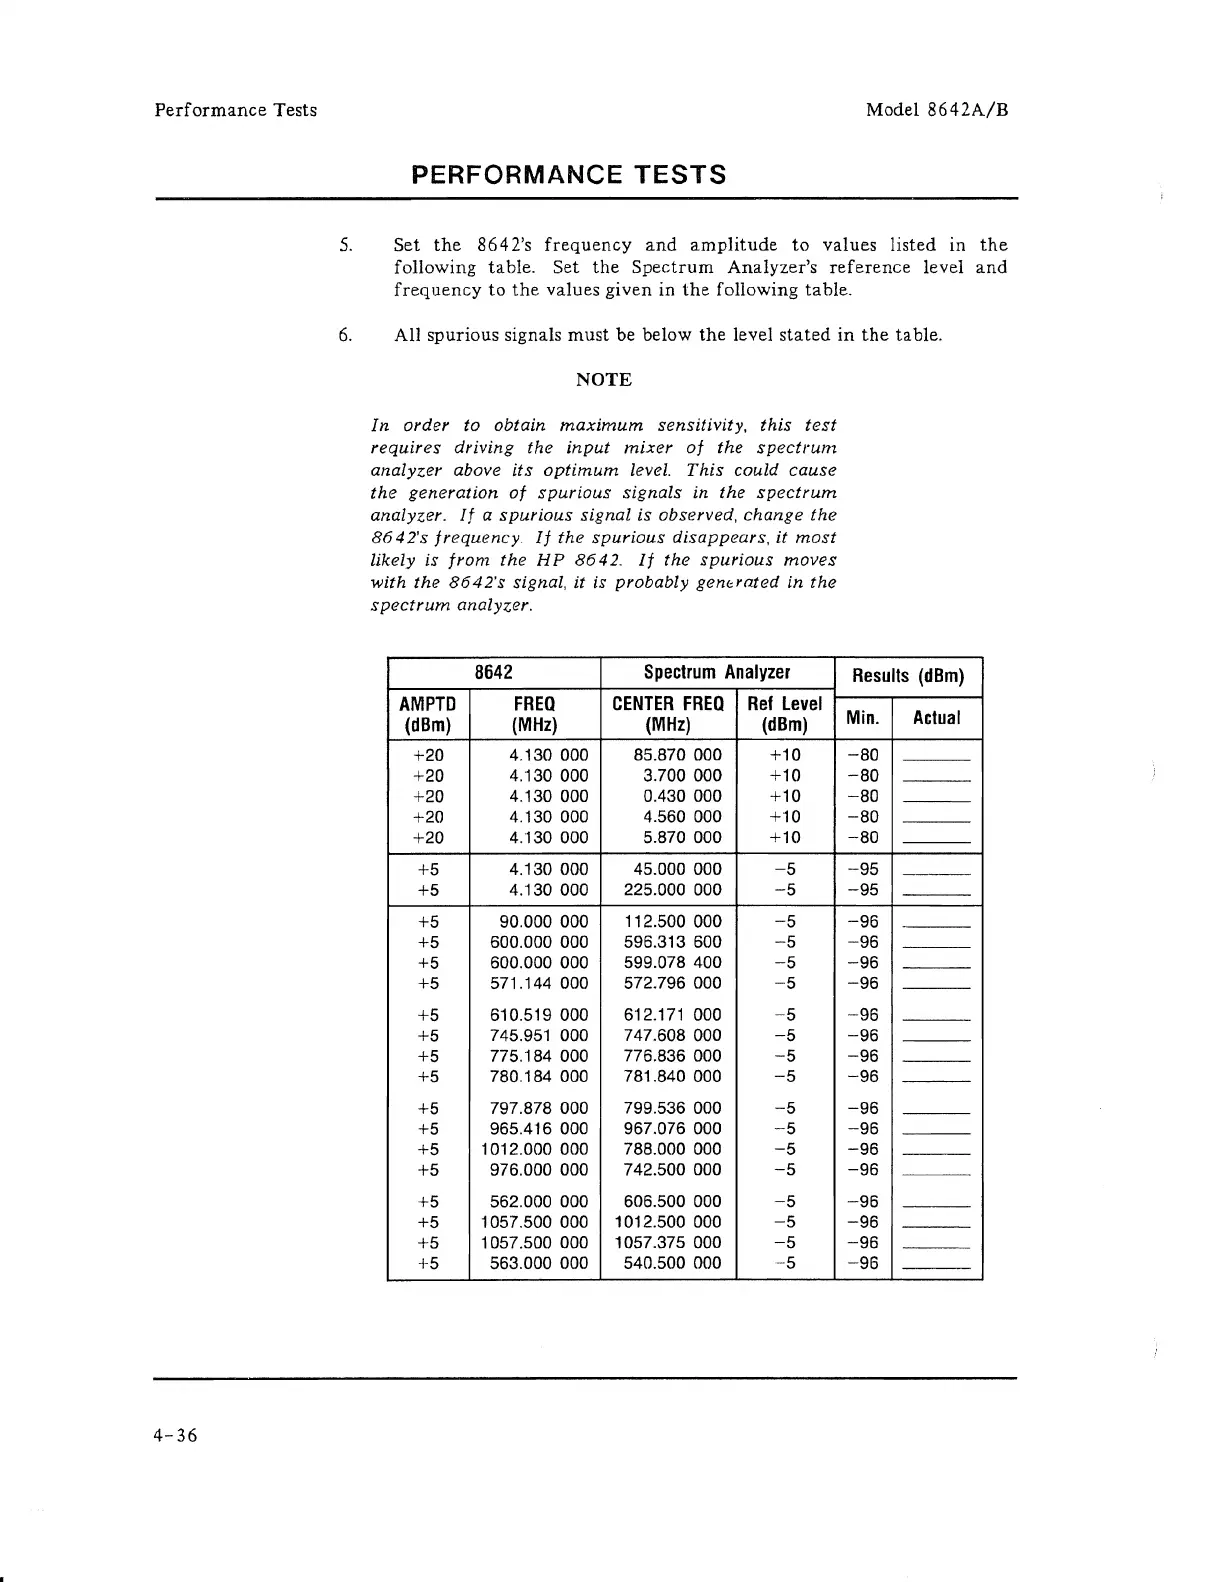
5.
Set
the
864
2's
frequency
and
amplitude
to
values
listed
in
the
following
table.
Set
the
Spectrum
Analyzer's
reference
level
and
frequency
to
the
values
given
in
the
following
table.
6.
All
spurious
signals
must
be below
the
level
stated
in
the
table.
NOTE
In
order
to
obtain
maximum
sensitivity,
this
test
requires
driving
the
input
mixer
of
the
specttum
analyzer
above
its
optimum
level.
This
could
cause
the
generation
ot
spurious
signals
in
the
spectrum
analyzer.
If
a
spurious
signal
is
observed,
change
the
8642's
frequency
If
the
spurious
disappears,
it
most
likely
is
from
the
HP
8642.
If
the
spurious
moves
with
the
8642's
signal,
it
is
probably
gen(;:Yoted
in
the
spectrum
analyzer.
8642
Spectrum
Analyzer
AMPTD
FREQ
CENTER
FREQ
Ref
level
(dBm)
(MHz)
(MHz)
(dBm)
+20
4,130000
85.870 000
+10
+20
4.130 000
3.700 000
+10
+20
4.130 000 0.430 000
+10
+20
4.130000
4.560 000
+10
+20
4.130 000 5.870 000
+10
+5
4.130 000 45.000 000
-5
+5
4.130 000 225.000 000
-5
+5
90.000 000 112.500 000
-5
+5
600.000 000 596.313 600
-5
+5
600.000 000
599.078400
-5
+5
571.144 000 572.796 000
-5
+5
610.519 000 612.171 000
-5
+5
745.951 000 747.608 000
-5
+5
775.184 000 776.836 000
-5
+5
780,184 000 781.840 000
-5
+5
797.878 000 799.536 000
-5
+5
965,416 000 967.076 000
-5
+5
1012.000 000
788,000 000
-5
+5
976.000 000 742.500 000
-5
+5
562.000 000 606.500 000
-5
+5
1057.500 000 1012.500 000
-5
+5
1057.500 000
1057.375 000
-5
+5
563.000 000 540.500 000
-5
Results
(dBm)
Min.
Actual
-80
-80
-80
-80
-80
-95
-95
-96
-96
-96
-96
-96
-96
-96
-96
-96
-96
-96
-96
-96
-96
-96
-96

Table of Contents

Other manuals for HP 8642A

Related product manuals