Model 8901B Service
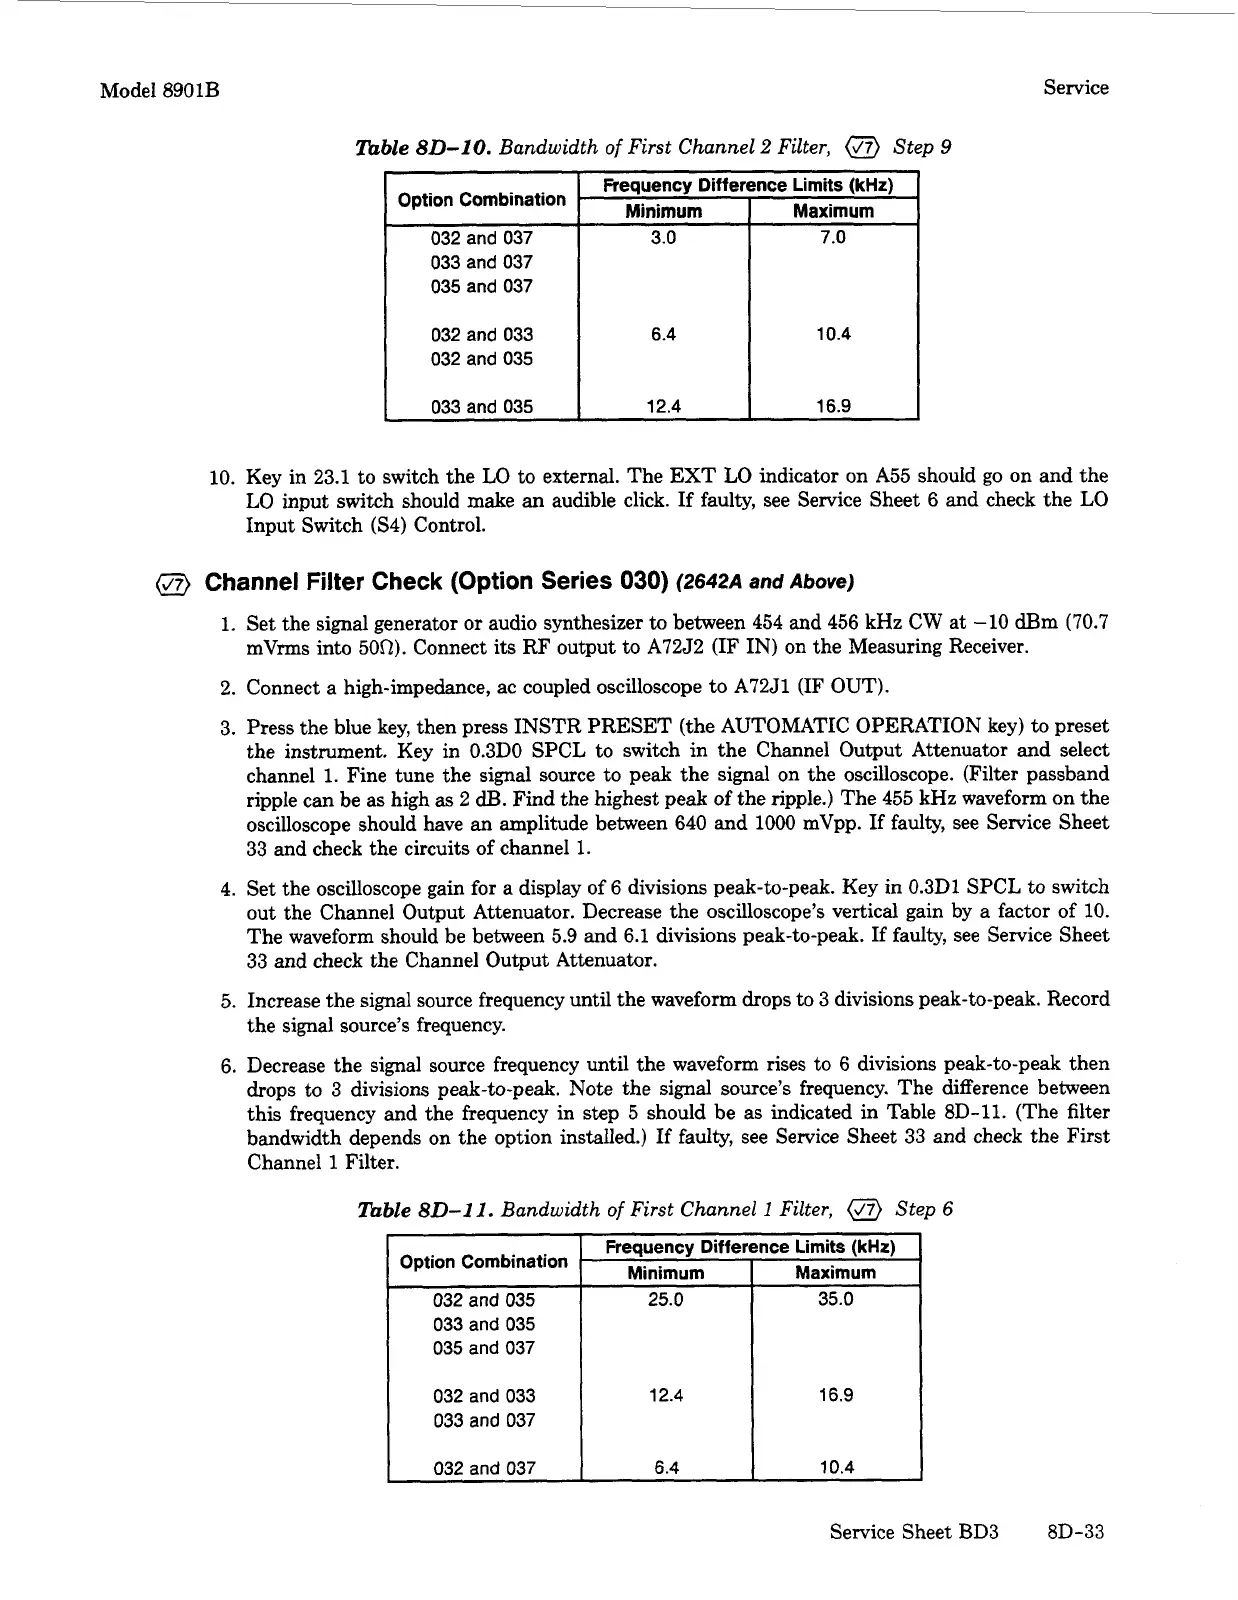
Option Combination
032
and
037
033
and
037
035
and
037
032
and
033
032
and
035
033
and
035
Frequency Difference Limits
(kHz)
Minimum Maximum
3.0 7.0
6.4 10.4
12.4 16.9
10. Key in
23.1
to switch the
LO
to external. The EXT
LO
indicator on A55 should
go
on and the
LO
input switch should make an audible click. If faulty, see Service Sheet
6
and check the LO
Input Switch
(S4)
Control.
032
and
035
033
and
035
(J7)
Channel
Filter
Check (Option Series
030)
(2642A
and
Above)
I
25.0 35.0
1.
2.
3.
4.
5.
6.
035
and
037
032
and
033
033
and
037
Set the signal generator
or
audio synthesizer to between
454
and
456
kHz
CW
at -10
dl3m
(70.7
mVrms into
500).
Connect
its
RF output to A7252
(IF
IN) on the Measuring Receiver.
Connect a high-impedance, ac coupled oscilloscope to A72J1 (IF
OUT).
Press the blue key, then press INSTR PRESET (the AUTOMATIC OPERATION key) to preset
the instrument. Key in 0.3DO SPCL
to
switch in the Channel Output Attenuator and select
channel
1.
Fine tune the signal source to peak the signal on the oscilloscope. (Filter passband
ripple can be as high as
2
dB.
Find the highest peak of the ripple.) The
455
kHz waveform on the
oscilloscope should have an amplitude between
640
and 1000 mVpp.
If
faulty, see Service Sheet
33 and check the circuits of channel
1.
Set the oscilloscope gain for
a
display
of
6
divisions peak-to-peak. Key in 0.3D1 SPCL to switch
out the Channel Output Attenuator. Decrease the oscilloscope’s vertical gain by a factor of 10.
The waveform should be between
5.9
and 6.1 divisions peak-to-peak.
If
faulty, see Service Sheet
33
and check the Channel Output Attenuator.
Increase the signal source frequency until the waveform drops to 3 divisions peak-to-peak. Record
the signal source’s frequency.
Decrease the signal source frequency until the waveform rises to
6
divisions peak-to-peak then
drops to
3
divisions peak-to-peak. Note the signal source’s frequency. The difference between
this frequency and the frequency in step
5
should be as indicated in Table 8D-11. (The filter
bandwidth depends on the option installed.)
If
faulty, see Service Sheet 33 and check the First
Channel
1
Filter.
12.4 16.9
llzble
8D-11.
Bandwidth
of
First Channel
1
Filter,
Step
6
032
and
037
Frequency Difference Limits
(kHz)
I
Maximum
I
Option Combination
I
Minimum
6.4 10.4
Service Sheet
BD3
8D-33


 To Next Page