2-
5
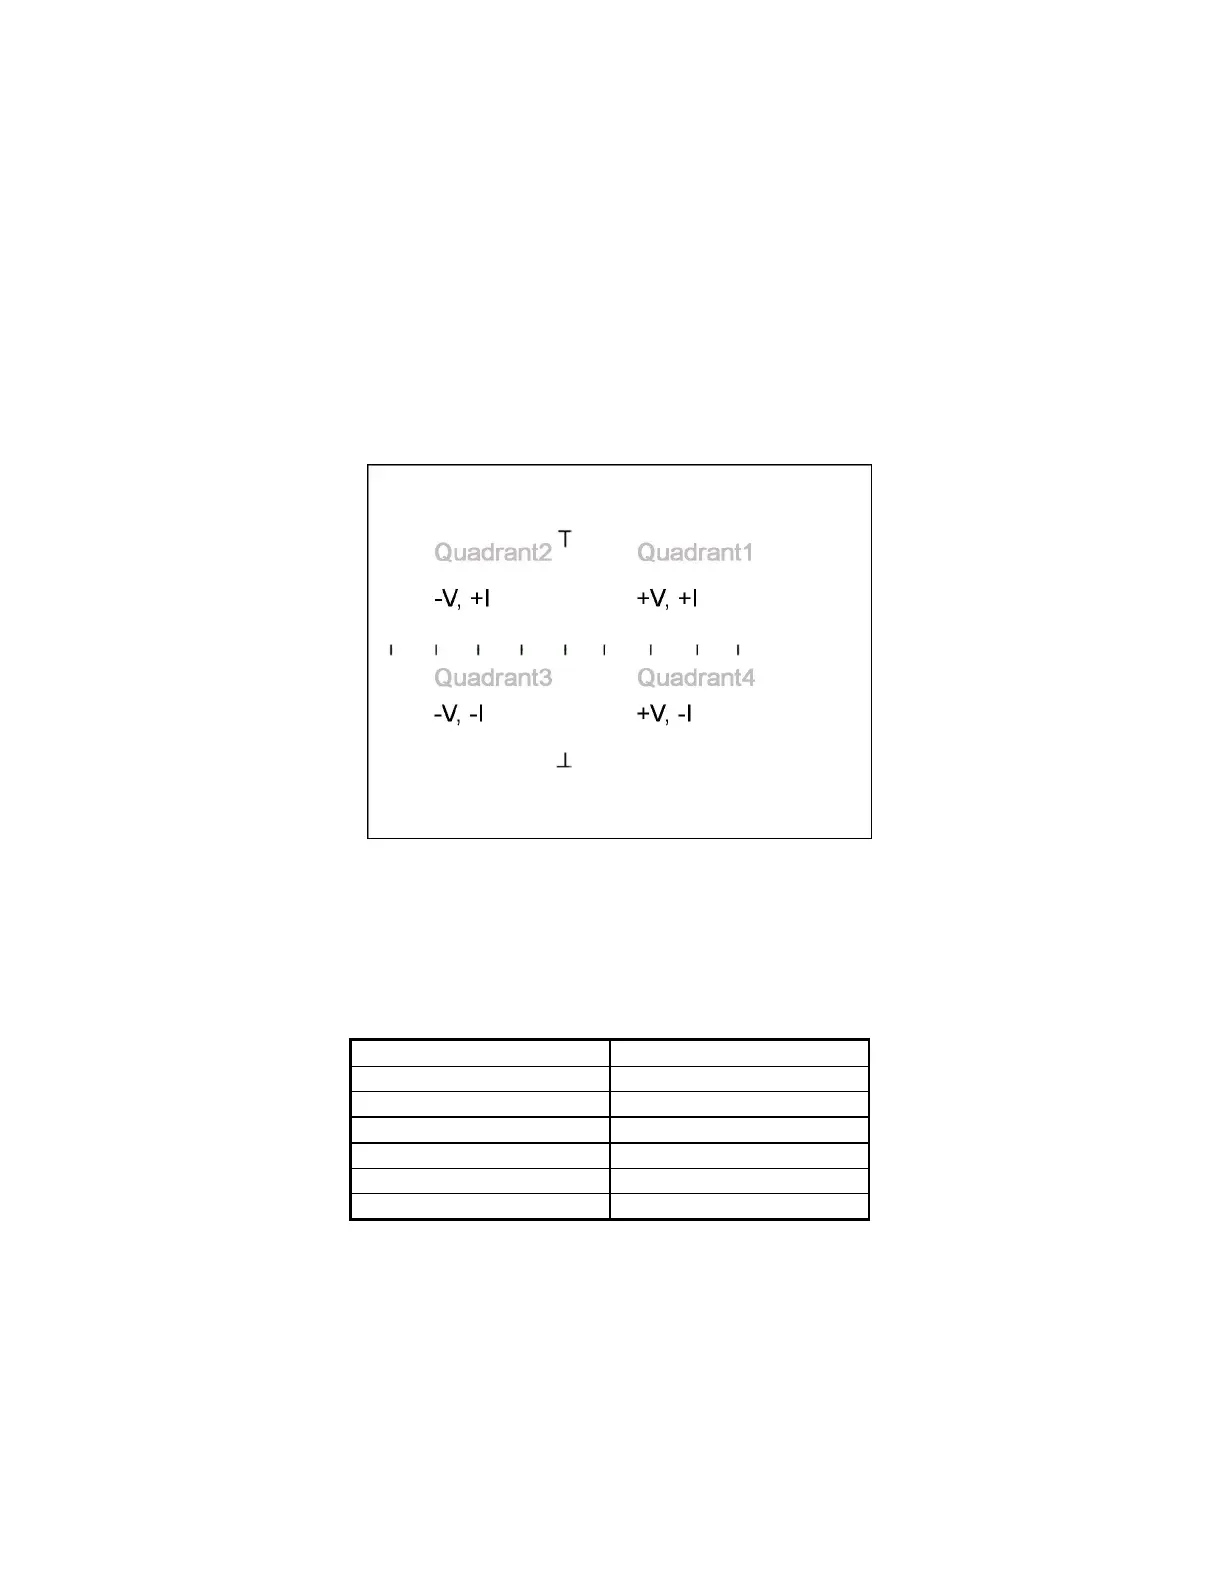
2-8. LCD Quadrants and Axes
The LCD displays the signature of the component(s) being tested. The display has a graticule
consisting of a horizontal axis which represents voltage, and a vertical axis which represents
current. The axes divide the display into four quadrants. Each quadrant displays different
portions of the signatures. Quadrant 1 displays positive voltage (+V) and positive current (+I),
quadrant 2 displays negative voltage (-V) and positive current (+I), quadrant 3 displays negative
voltage (-V) and negative current (-I), and quadrant 4 displays positive voltage (+V) and negative
current (-I). See Figure 2-3.
The horizontal axis is divided in eight divisions, which allows the operator to estimate the voltage
at which changes in the signature occur. This is mainly useful in determining semiconductor
junction voltages under either forward or reverse bias. Table 2-3 lists the approximate horizontal
sensitivities for each range.
Figure 2-3. Graticule Quadrants.
Range Volts/Div
20V 5.00
15 V 3.75
10 V 2.50
5 V 1.25
3 V 0.75
200 mV 0.05
Table 2-3 Tracker 2700 Horizontal Sensitivities
2-9. Power-Up
Turn the Power switch (located on the back panel) to the “ON” position. The Tracker 2700 should
come on with the LEDs for channel A, 200mV, and 10Ω illuminated. The frequency parameter
will automatically be set to the last selected frequency before power-down.
 Loading...