3-
3
The voltage across the component under test controls the amount of horizontal trace deflection
on the LCD display. When the component under test is removed, creating an open circuit (e.g.,
R
L
=
∞
), the voltage at the output terminals is at its maximum and thus the trace on the display is
a straight horizontal line with its maximum width.
The horizontal axis is divided up by small graticule lines similar to those on a conventional
oscilloscope CRT. Each mark is approximately 1/4 of the peak range voltage. For example, in
the 10 V range, each division is approximately 2.5 V. You can use these graticule marks to get a
rough estimate of the voltage drop across the component under test. Changing the V
s
of the test
range effectively acts the same as changing the Volts-per-division on an oscilloscope.
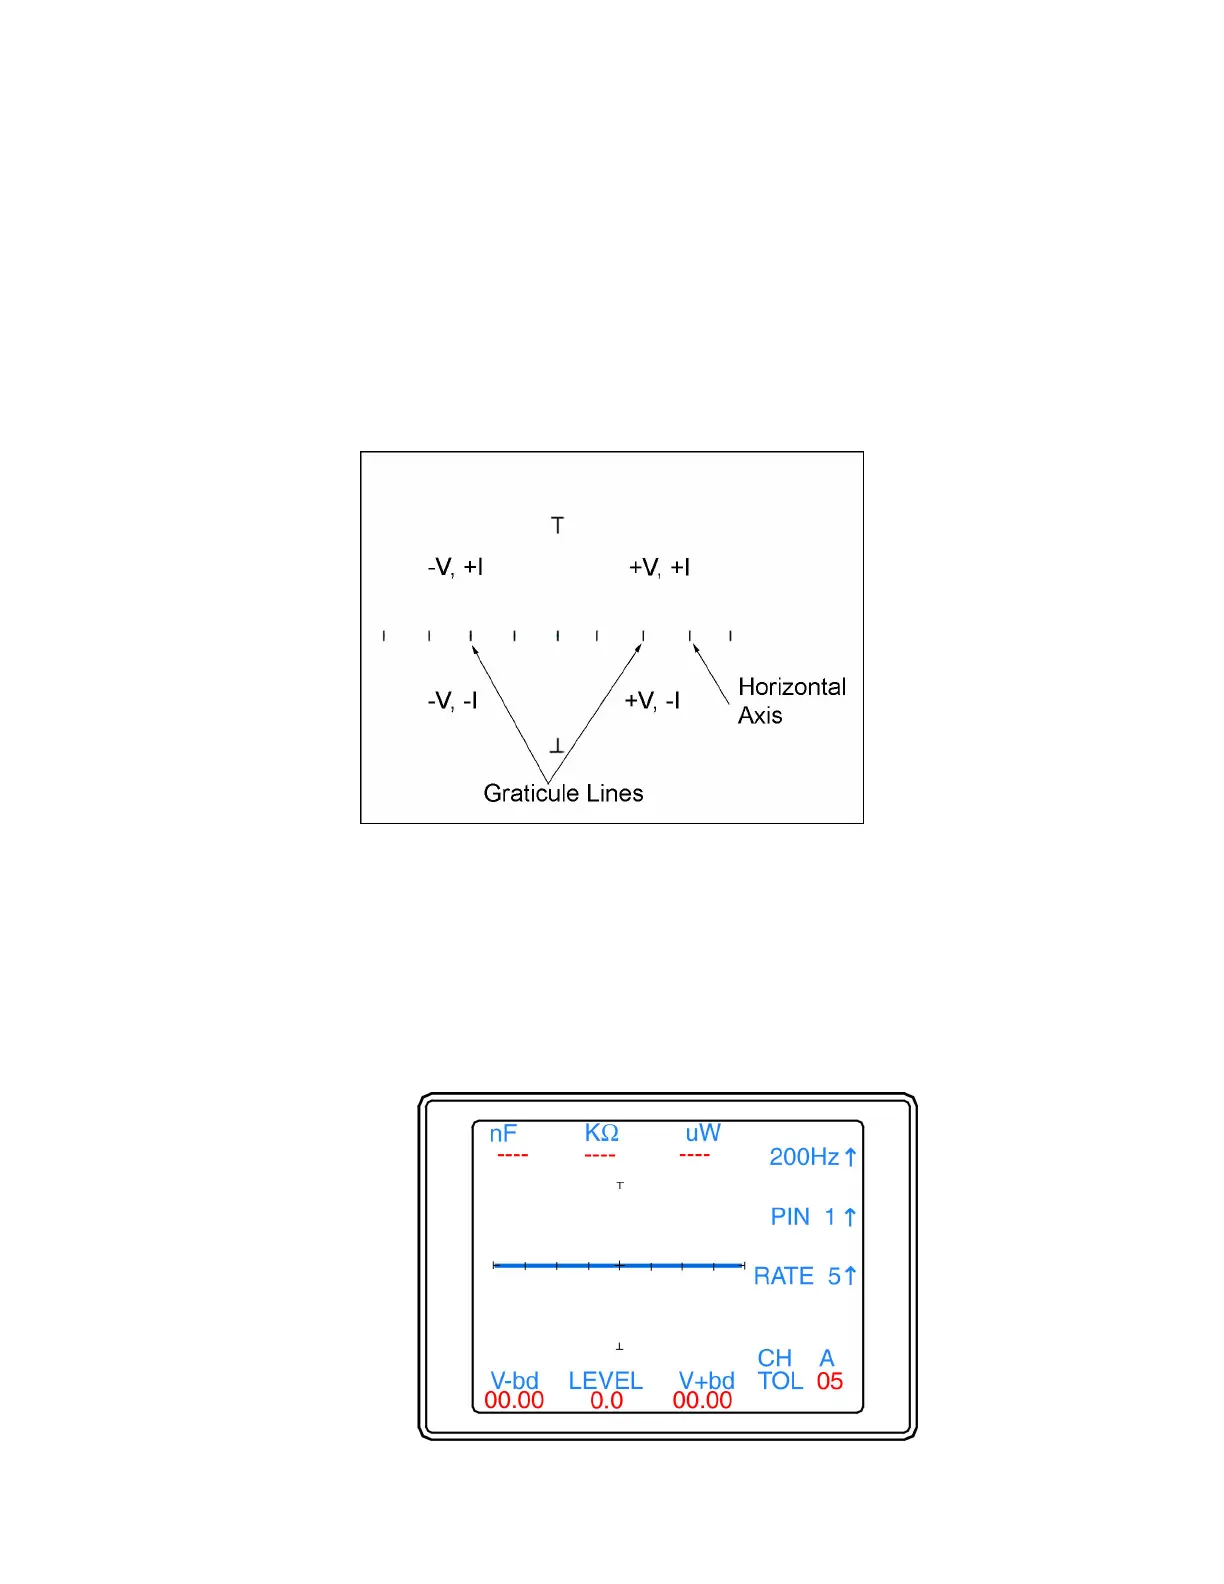
The Signature viewing area of the LCD screen can also be set up in quadrants to show positive
and negative current and voltage characteristics. Refer to figure 3.3.
Figure 3-3. LCD Display Horizontal Axis And Graticule Lines.
When the test signal is positive, this means that the voltage and current are positive so the
signature's trace is on the right hand side of the LCD display. When the test signal is negative,
the voltage and current are negative so the trace is in the left hand side of the display.
Turn on the Tracker 2700 and observe the LCD display. With nothing connected to its test
terminals, the display trace is a horizontal line (that is, R
L
=
∞
).
 Loading...