Startup Guide
9
Step 9 View graph
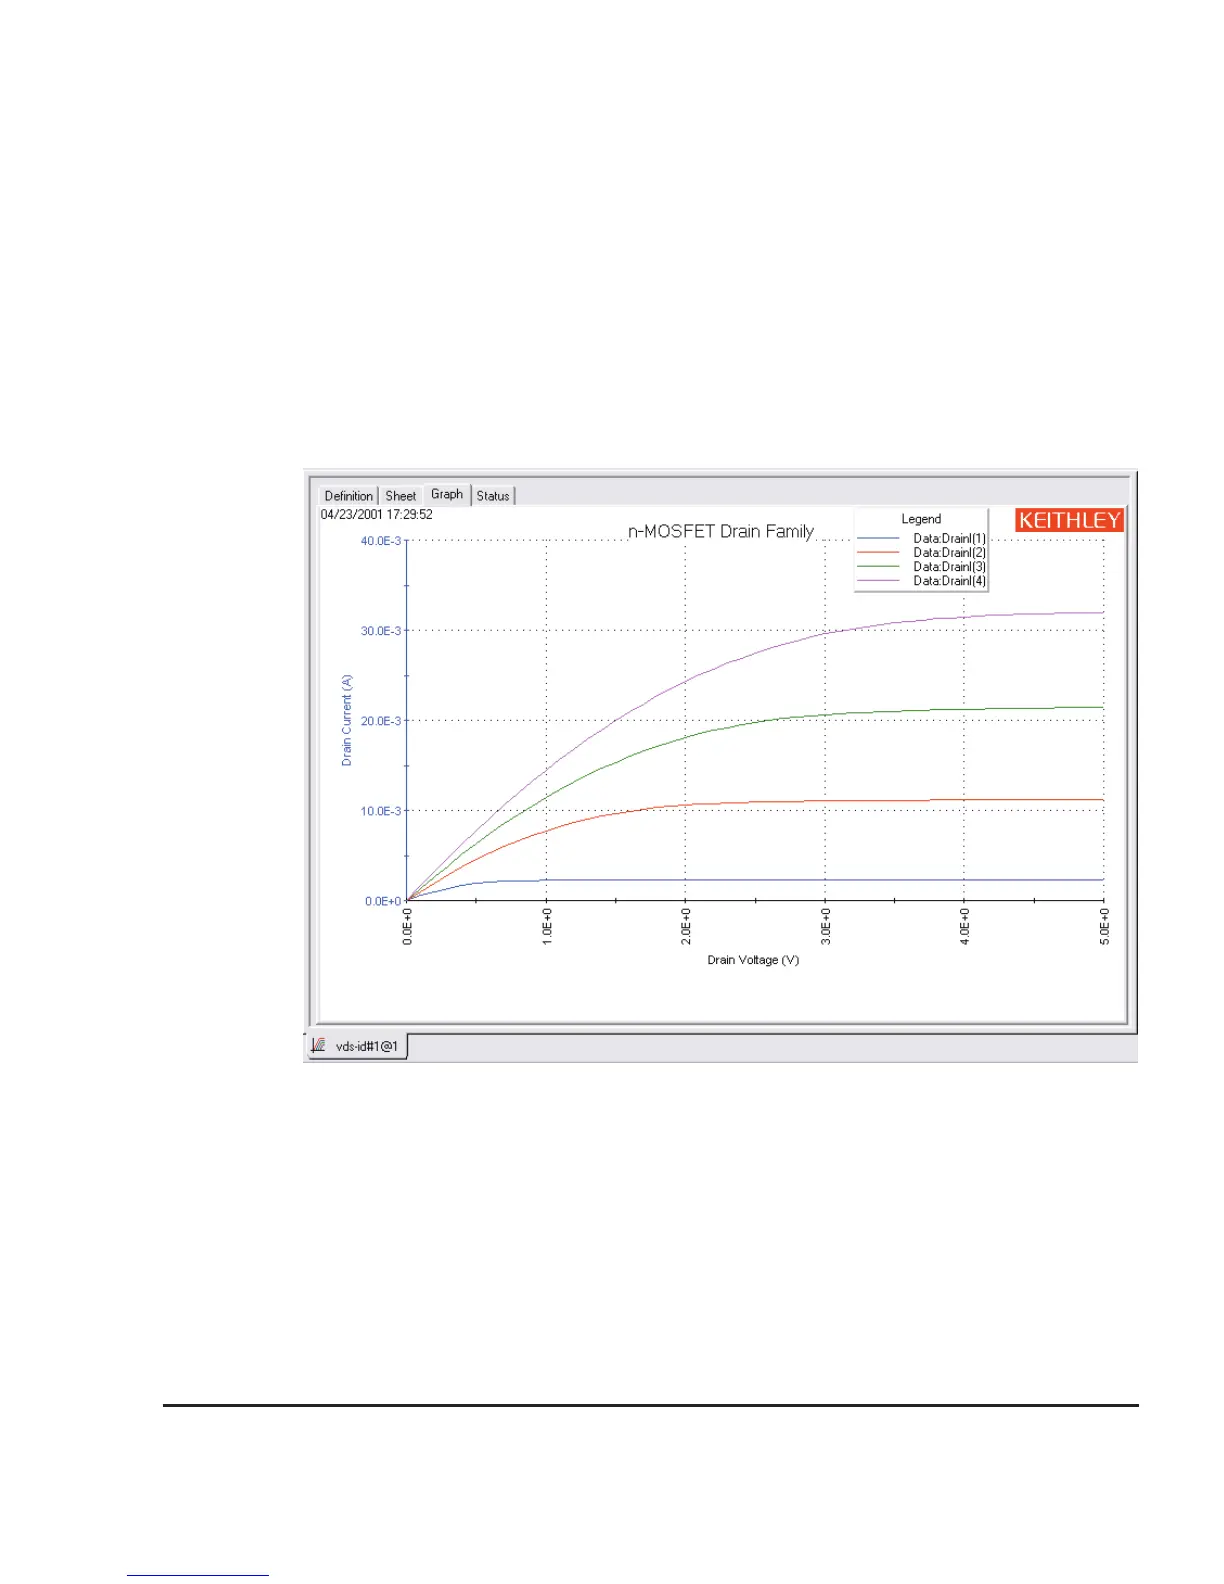
The graph for the “vds-id” test is displayed by clicking the Graph tab for the test. A sample graph for the
“vsd-id” test is shown in Figure 9. As shown, there are four I-V curves – one for each gate voltage. The
graph was customized to include the Legend box and use different colors for the graph series. The Graph
Settings menu (shown in Figure 10) was used to select the Legend box and change series colors.
Figure 9: Sample graph for “vds-id” test
 Loading...