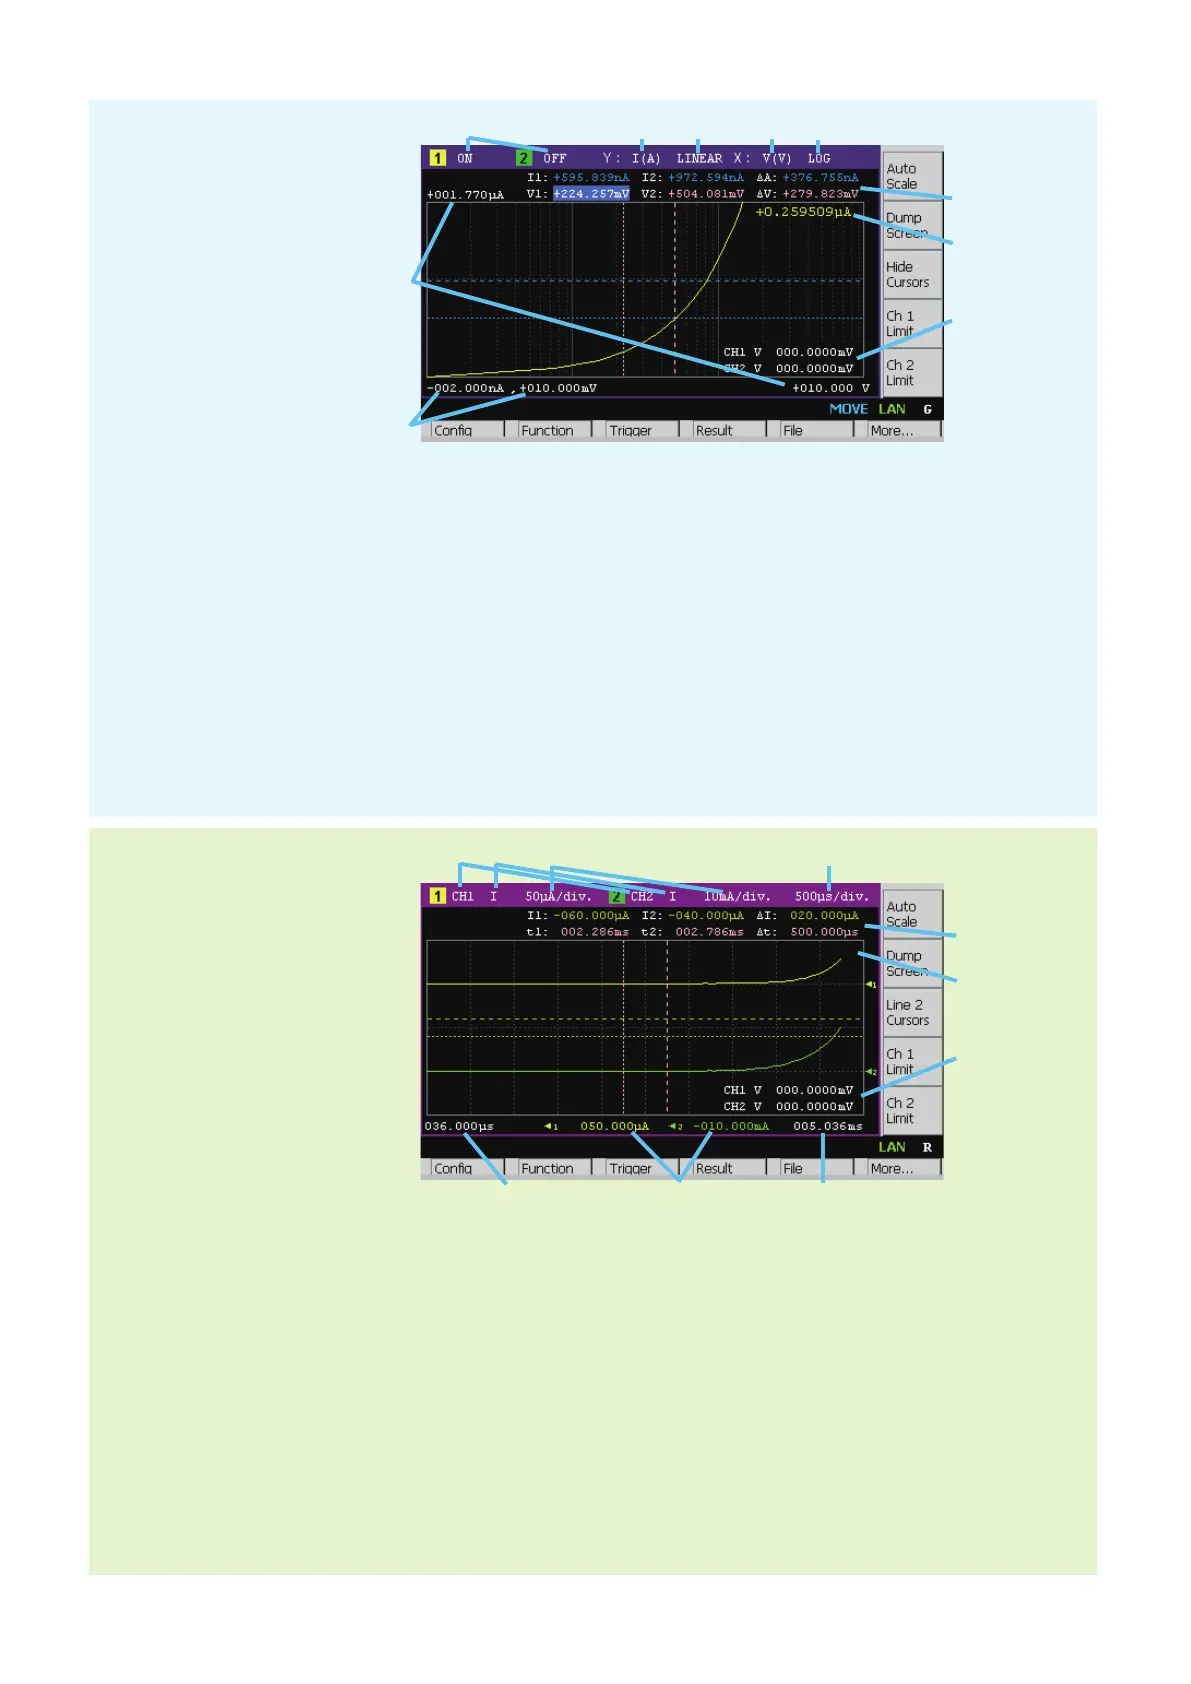
1. Graph display status ON or OFF. Only on 2-channel models. [n] is for channel n.
2. Y-axis data type I (A), V (V), R (W), P (W), or MATH
3. Y-axis scale LINEAR or LOG
4. X-axis data type I (A), V (V), R (W), P (W), MATH, t (s), V1, or V2
5. X-axis scale LINEAR or LOG
6. Graph maximum value
7. Graph minimum value
8. Channel 1 and/or 2 source output value, limit value, or none (controlled by the Ch n Source, Ch n Limit, or Hide
Ch n assist key)
9. Channel 1 and/or 2 Y-axis data at the active X-cursor position. ----.---- is displayed for the no-data position.
10. Cursor data (controlled by the Show Cursors or Hide Cursors assist key)
First line Positions and distance (e.g. I1, I2, ΔA) of Y-cursors 1 and 2
Second line Positions and distance (e.g. t1, t2, Δt) of X-cursors 1 and 2
1 2 3 4 5
6
7
8
9
10
Graph View
1. Displays status ON or OFF, on B2911B
Displays status Ch 1, Ch 2, or OFF, on B2912B
Two lines can be displayed on the graph. [1] indicates the graph setup for line 1. [2] indicates the graph setup
for line 2.
2. Y-axis data type I, V, R, or P.
3. Y-axis scale per division A/div., V/div., W/div., or W/div.
4. X-axis scale per division s/div.
5. X-axis minimum value (minimum timestamp)
6. Y-axis offset values for line 1 and 2
7. X-axis maximum value (maximum timestamp)
8. See Graph View.
9. See Graph View.
10. See Graph View.
Roll View
1 2 3 4
5 6 7
8
9
10
Displays the time domain graph
for plotting the channel 1 and/or
2 measurement data.
(Only on B2911B/B2912B)
Displays the graph for plotting
the channel 1 and/or 2
measurement or math result.